Affiliation(s):
. Minnesota Dental Research Centre for Biomaterials and Biomechanics, School of Dentistry, University of Minnesota, Minneapolis, MN 55455, USA
Jian-ying Li, Andrew Lau, Alex S. L. Fok. Application of digital image correlation to full-field measurement of shrinkage strain of dental composites[J]. Journal of Zhejiang University Science A, 2013, 14(1): 1-10.
@article{title="Application of digital image correlation to full-field measurement of shrinkage strain of dental composites", author="Jian-ying Li, Andrew Lau, Alex S. L. Fok", journal="Journal of Zhejiang University Science A", volume="14", number="1", pages="1-10", year="2013", publisher="Zhejiang University Press & Springer", doi="10.1631/jzus.A1200274" }
%0 Journal Article %T Application of digital image correlation to full-field measurement of shrinkage strain of dental composites %A Jian-ying Li %A Andrew Lau %A Alex S. L. Fok %J Journal of Zhejiang University SCIENCE A %V 14 %N 1 %P 1-10 %@ 1673-565X %D 2013 %I Zhejiang University Press & Springer %DOI 10.1631/jzus.A1200274
TY - JOUR T1 - Application of digital image correlation to full-field measurement of shrinkage strain of dental composites A1 - Jian-ying Li A1 - Andrew Lau A1 - Alex S. L. Fok J0 - Journal of Zhejiang University Science A VL - 14 IS - 1 SP - 1 EP - 10 %@ 1673-565X Y1 - 2013 PB - Zhejiang University Press & Springer ER - DOI - 10.1631/jzus.A1200274
Abstract: Objectives: polymerization shrinkage of dental composites remains a major concern in restorative dentistry because it can lead to micro-cracking of the tooth and debonding at the tooth-restoration interface. The aim of this study was to measure the full-field polymerization shrinkage of dental composites using the optical digital image correlation (DIC) method and to evaluate how the measurement is influenced by the factors in experiment setup and image analysis. Methods: Four commercial dental composites, Premise Dentine, Z100, Z250 and Tetric EvoCeram, were tested. Composite was first placed into a slot mould to form a bar specimen with rectangular-section of 4 mm×2 mm, followed by the surface painting to create irregular speckles. Curing was then applied at one end of the specimen while the other part were covered against curing light for simulating the clinical curing condition of composite in dental cavity. The painted surface was recorded by a charge-coupled device (CCD) camera before and after curing. Subsequently, the volumetric shrinkage of the specimen was calculated with specialist DIC software based on image cross correlation. In addition, a few factors that may influence the measuring accuracy, including the subset window size, speckle size, illumination light and specimen length, were also evaluated. Results: The volumetric shrinkage of the specimen generally decreases with increasing distance from the irradiated surface with a conspicuous exception being the composite Premise Dentine as its maximum shrinkage occurred at a subsurface distance of about 1 mm instead of the irradiated surface. Z100 had the greatest maximum shrinkage strain, followed by Z250, Tetric EvoCeram and then Premise Dentine. Larger subset window size made the shrinkage strain contour smoother. But the cost was that some details in the heterogeneity of the material were lost. Very small subset window size resulted in a lot of noise in the data, making it difficult to discern the general pattern in the strain distribution. Speckle size did not seem to have obvious effect on the volumetric shrinkage strain along specimen length; however, larger speckles resulted in higher level of noise or heterogeneity in the shrinkage distribution. Compared with bright illumination, dimmer lighting produced larger standard deviations in the measured shrinkage, indicating a higher level of noise. The longer the specimen, the greater was the rate of reduction with distance from the irradiated surface, especially for the longitudinal strain. Significance: The image correlation method is capable of producing full-field polymerization shrinkage of dental composites. The accuracy of the measurements relies on selection of optimal parameters in experimental setup and DIC analysis.
Darkslateblue:Affiliate; Royal Blue:Author; Turquoise:Article
Article Content
1. Introduction
Light-cured, polymer-based dental composites are now widely used for restoring decayed or damaged teeth. However, polymerization shrinkage of these materials remains a major concern in restorative dentistry. This is because the resulting shrinkage stresses can lead to premature failure of the restoration via micro-cracking of the tooth and debonding at the tooth-restoration interface, which in turn results in marginal leakage and ultimately recurrent caries (Hübsch et al., 1999; Palin et al., 2005). Therefore, the assessment of their shrinkage behaviour during curing (or polymerization) is a major topic in the research and development of dental composites.
A number of methods for measuring the polymerization shrinkage of dental composites have been developed over the years, the simplest among them being that based on Archimedes’ principle, i.e., dilatometry. With this method, a composite sample is immersed into a bath of mercury or water, and the volumetric shrinkage of the material during polymerization is determined from the fall in liquid level of the measurement column (de Gee et al., 1981).
Another common method for measuring volumetric shrinkage of dental composites is the bonded disc method (Watts and Cash, 1991). With this method, a thin disc of the dental composite is sandwiched between an upper thin piece of glass diaphragm and a lower rigid glass plate, through which light-curing of the composite takes place. The deflection of the diaphragm caused by the shrinking composite during polymerization is then measured using a linear voltage differential transducer (LVDT). Because the composite disc is bonded to the glass diaphragm and plate, almost all the volumetric shrinkage occurs in the vertical direction. Thus, the shrinkage strain in this direction is roughly equal to the volumetric strain, i.e., three times the linear value under free shrinkage. As would be expected, the true linear shrinkage strain can be measured using the non-bonded disc method (Lee et al., 2006).
Instead of a LVDT, the polymerization shrinkage of dental composites has also been measured using a laser interferometer, an optical magnifier and mechanical strain gauges (Sakaguchi et al., 1991; Fogleman et al., 2002; Demoli et al., 2004; Arenas et al., 2007). The latter measures the so-called post-gel shrinkage strain when the composite has developed significant stiffness and stresses to cause deformation in the devices (Sakaguchi et al., 1991; 1997). Some research has shown that the post-gel shrinkage strain has a higher correlation to the shrinkage stress that causes fracture and debonding in composite restorations than the total shrinkage strain.
Most of the shrinkage measuring methods described above have been discussed and compared in the literature (Sakaguchi et al., 2004; Lee et al., 2006). Despite their differences, they can all be classified as contact measurement methods because the composite sample is in direct contact with either a liquid or solid medium; for example, mercury or water in dilatometry, a glass diaphragm and a LVDT in the bonded or non-bonded disc method, and a strain gauge in the strain gauge method. Through gravitational and/or adhesive forces, the medium in contact will exert loads and/or constraints to the composite, hence, influencing the measurement of polymerization shrinkage, as seen in the bonded disc and strain gauge methods. Therefore, depending on the actual mechanical properties of the device used, different researchers may obtain different shrinkage strain measurements for the same composite material. There is also the possibility that the liquid in contact with the composite may affect its surface chemistry and, hence, polymerization shrinkage.
Shrinkage measurements using non-contact methods have been carried out by other investigators using, for example, laser beam scanning or video-imaging techniques (Fano et al., 1997; Sharp et al., 2003). With these techniques, the external dimensions of the composite specimen are recorded continuously during the polymerization process, from which the overall or bulk material shrinkage can be obtained. 3D micro-computed tomography (CT) imaging has also been used to measure polymerization shrinkage of dental composites placed in prepared teeth (Sun and Lin-Gibson, 2008). 3D displacement contours within the restorations were presented. However, because of the relatively long time it takes to scan a sample, the method is limited to measuring the final shrinkage only; no information on the shrinkage kinetics can be obtained.
Digital image correlation (DIC) is another non-contact optical method that has been used to measure polymerization shrinkage in dental composites. In a previous study (Li et al., 2009a), we show that, instead of just the overall shrinkage, full-field shrinkage strains showing local details can be obtained with this method for the whole surface of the specimen under observation. In this way, the depth of cure of the dental composite can also be measured. In this paper, we review DIC as a technique for the measurement of polymerization shrinkage of dental composite. More importantly, we look at some of the material and experimental factors that can affect the quality and accuracy of the results.
2. General introduction of the DIC technique
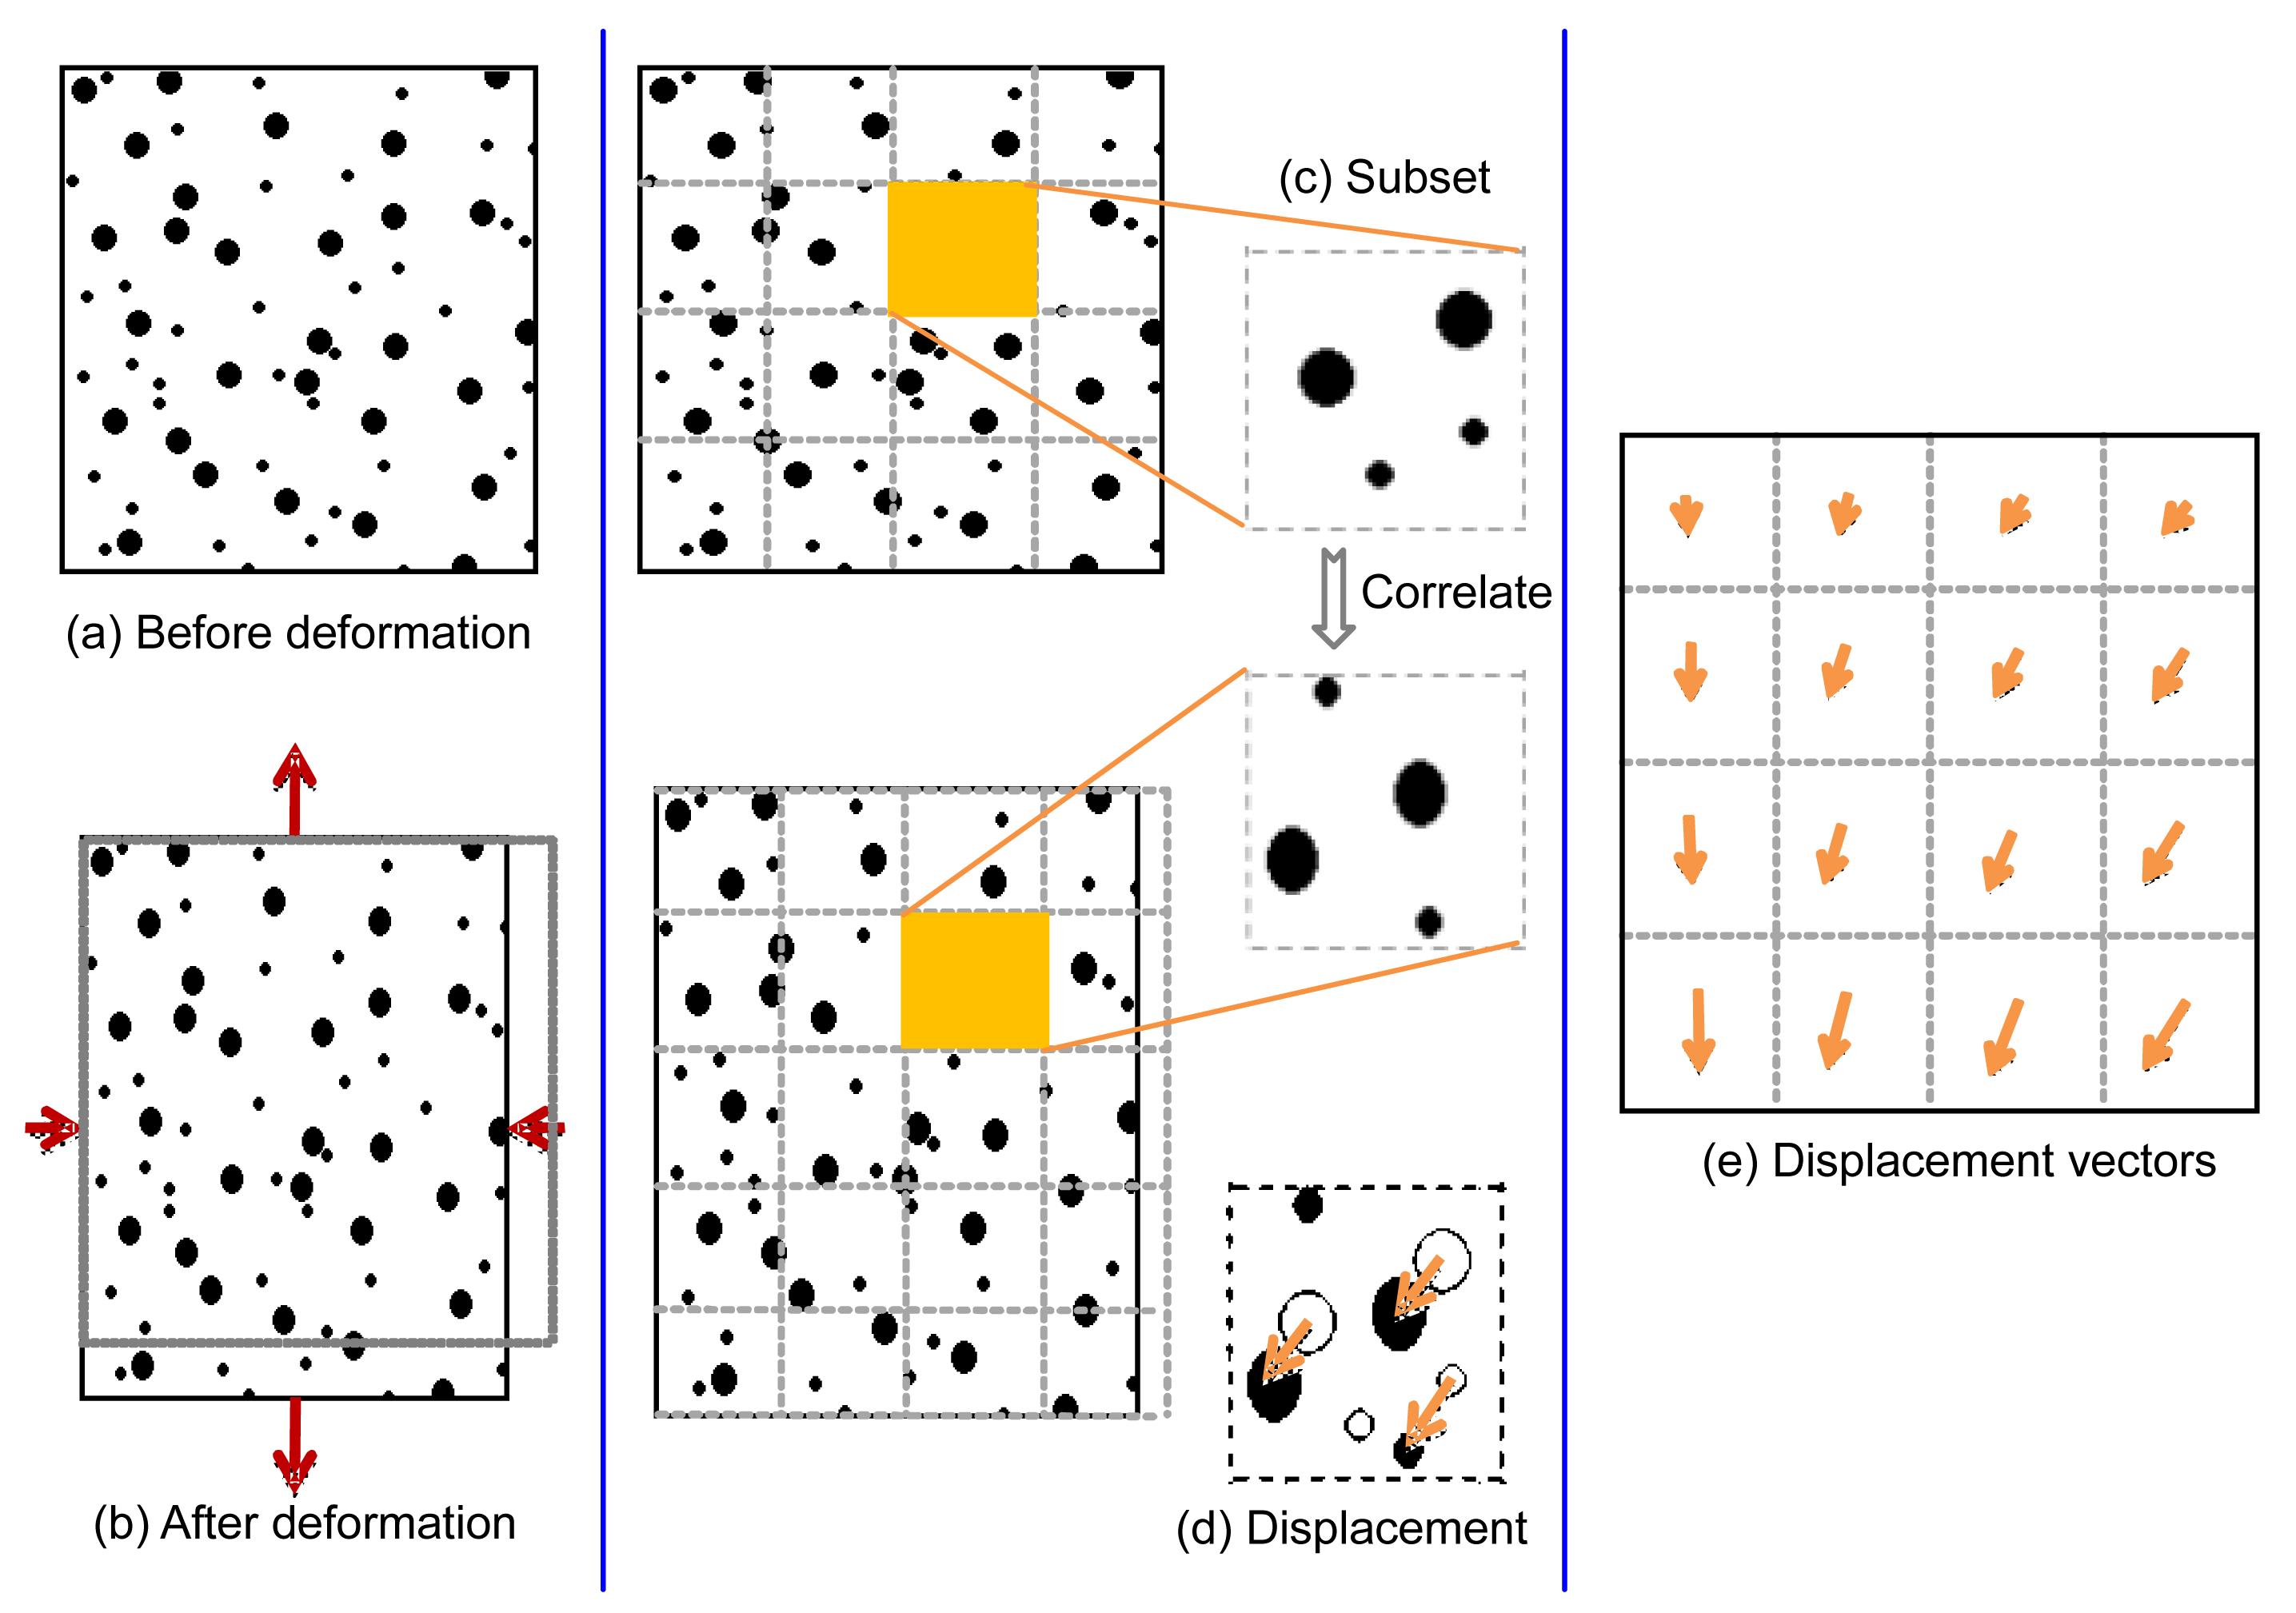
The DIC method originated at the University of South Carolina in the early 1980s and has been widely used in displacement, strain and flow measurements in recent years (Heise et al., 2003; Kang et al., 2007). The basic idea of DIC is, by comparing two or more corresponding images taken at different times, the deformation field can be extracted through tracking the movement of the visible features on a specimen’s surface. As illustrated in Fig. 1, two images, Figs. 1a and 1b, were taken before and after deformation of a specimen under tension. They were subsequently divided into a certain number of subset windows. Using the patterns on the specimen surface, i.e., those formed by the black spots in Fig. 1, image correlation was then performed for the corresponding subsets in the two images to obtain the displacement vectors, as shown in Figs. 1d and 1e. Finally, derivatives with respect to the spatial coordinates, i.e., strains, can be derived from the displacement field.
Fig.1 Procedures for calculating displacement vectors by image correlation based on the images taken before and after deformation of a specimen
Patterns with non-repeating features on the specimen surface are required for the DIC system to determine the surface deformation by tracking their movement. Therefore, artificial irregular patterns, e.g., those made by paint spraying, need to be produced on the surface being recorded if the natural surface texture of the specimen cannot provide high-contrast speckles in the recorded images.
In the work presented herewith, only one camera was used for image recording; which means that only in-plane movement and strain could be obtained. Out-of-plane movement can be identified only if two or more cameras are employed in the measurement. However, suitable assumptions would be made for the out-of-plane shrinkage and its effect on the in-plane measurements would also be assessed.
3. Materials and methods
3.1. Specimen preparation and experimental instruments
Four commercial dental composites were used in this investigation. The manufacturers and compositional information given by them of the tested materials are summarized in Table 1. They all had the same shade (A3), similar particle sizes (<3.5 μm) and similar filler loadings (60%–70% in volume).
Table 1
Manufacturers and compositions of the dental composites tested
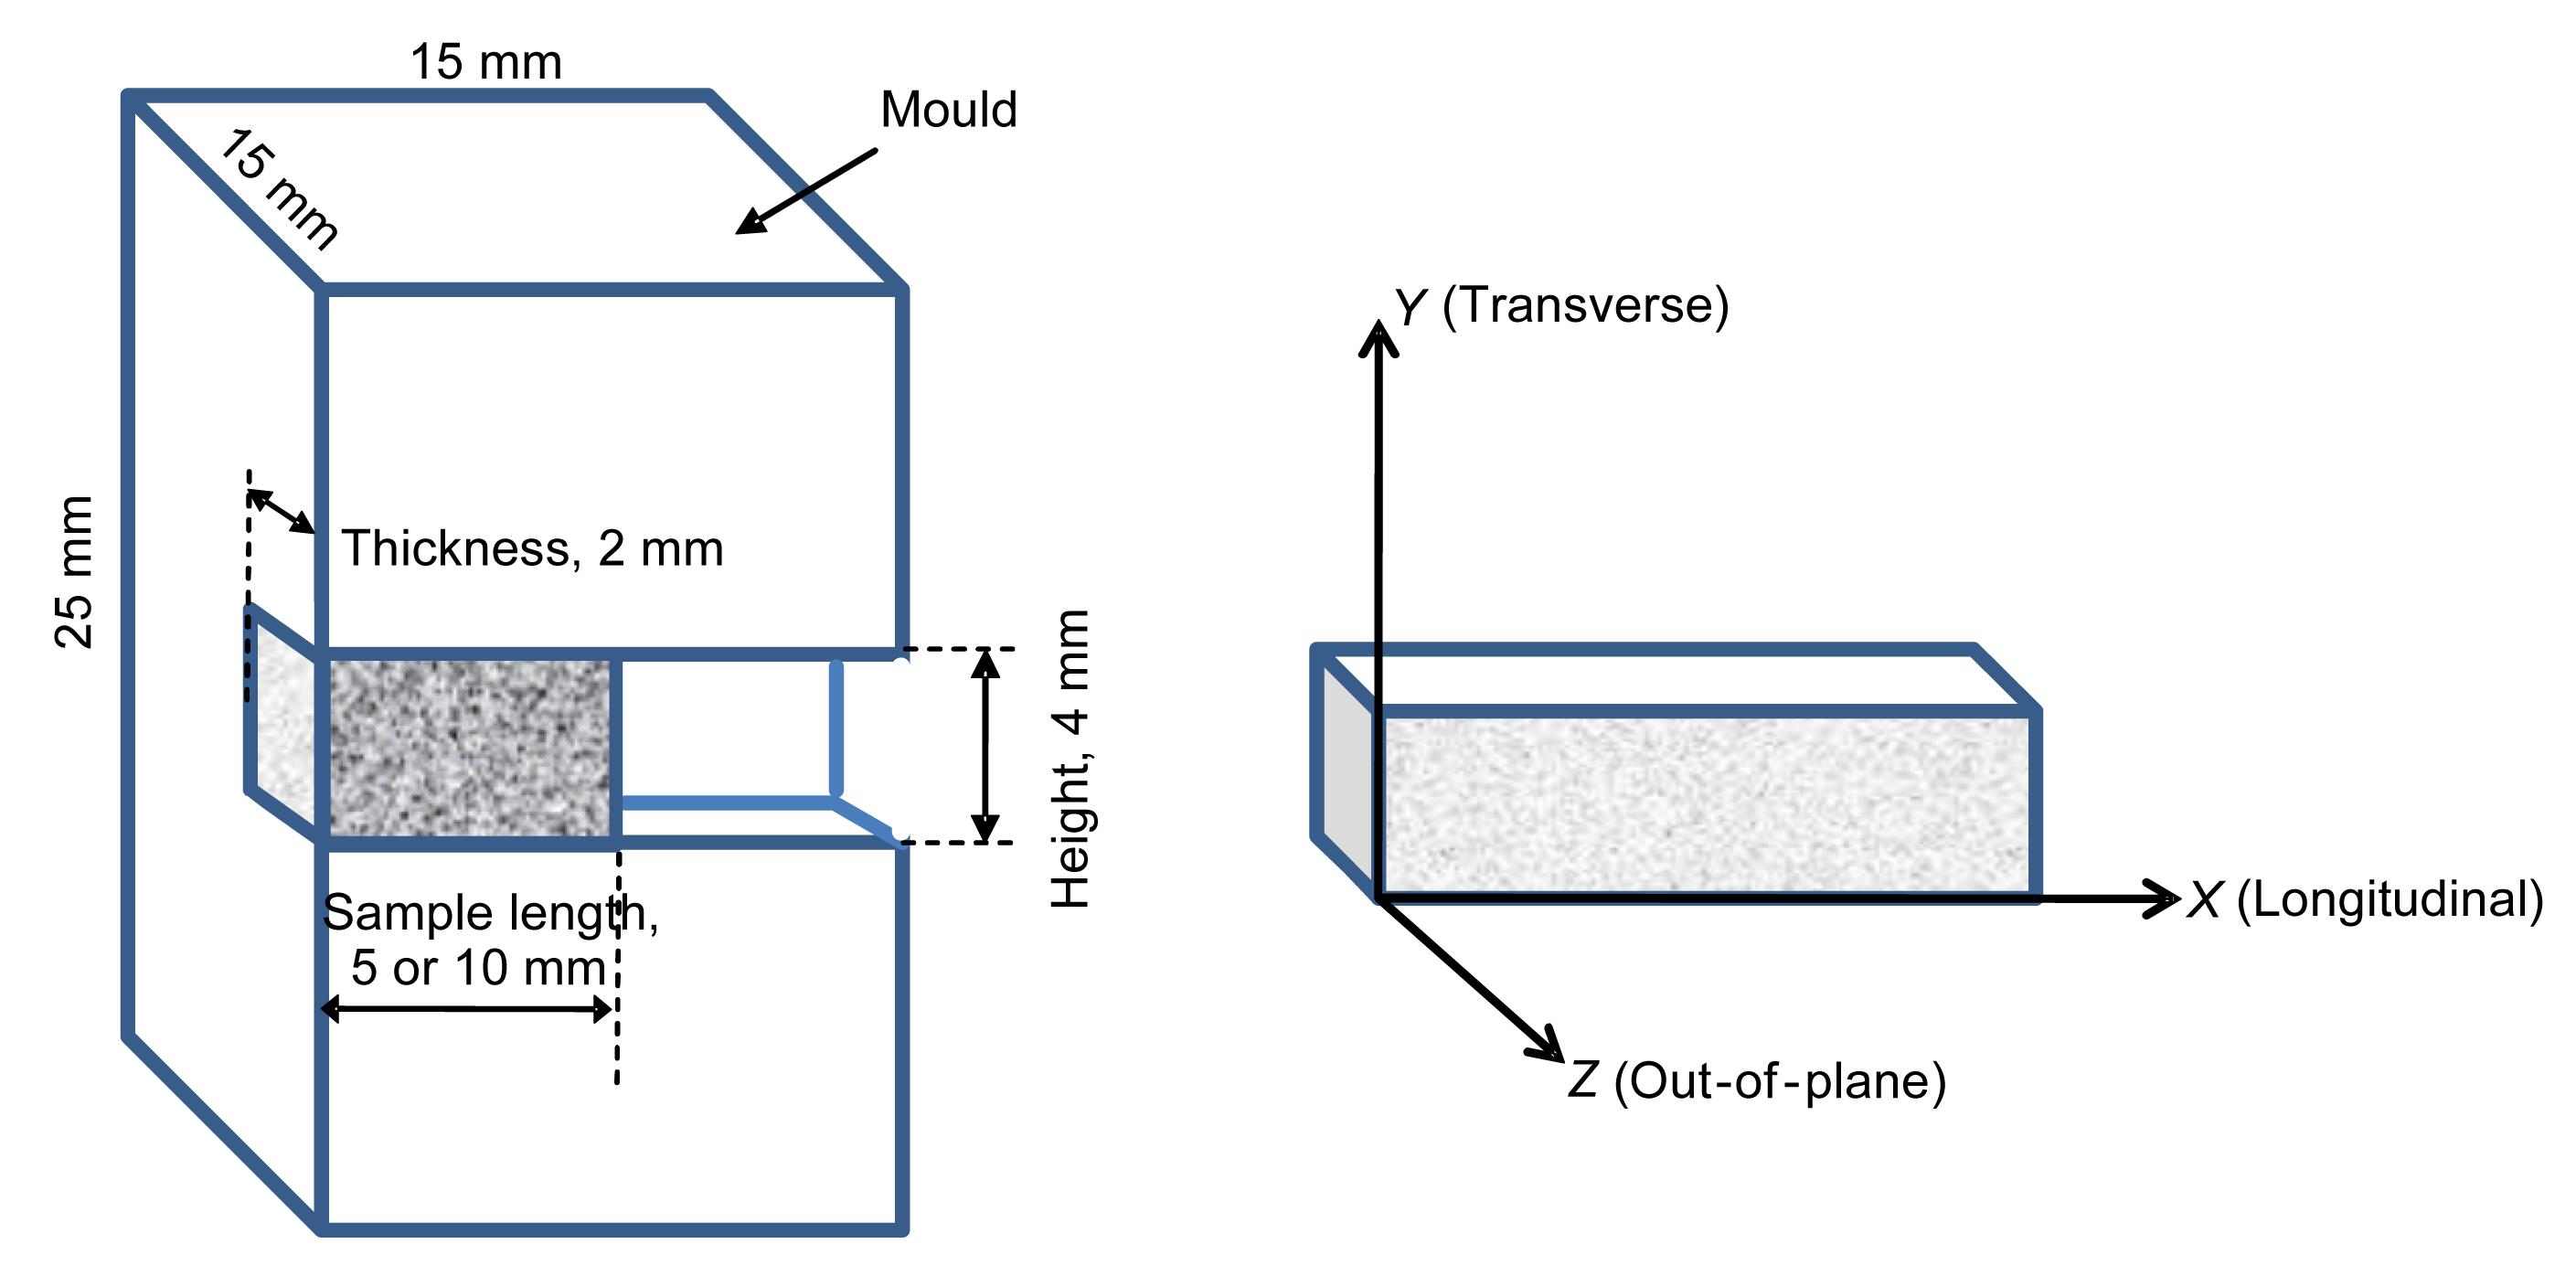
The sample preparation and experiment setup will be introduced briefly here since details can be found in (Li et al., 2009a). The composite material was placed into a mould with a rectangular-sectioned slot to form a bar specimen (Fig. 2). A thin layer of polytetrafluoroetylene (PTFE) tape was placed first in the slot prior to composite to prevent adhesion of the bar to the mould.
Fig.2 Dimensions of the steel mould and composite specimen, together with the coordinate system used to define the directions of shrinkage (Li et al., 2009a)
The surface of the composite bar facing the charge-coupled device (CCD) camera was sprayed with nano-sized black carbon powder to produce irregular-shaped speckles for tracking and analysis of surface movement by the image correlation system. The tests were performed at room temperature (~23 °C), with the specimen remaining in the mould throughout each test. During curing, the painted surface was covered by a lid to ensure that only the end face directly facing the curing light was irradiated and that no light could escape to the painted surface. After curing, the lid was removed immediately and recording of the deformation of the painted surface was performed with CCD camera after 30 min. The shrinkage strain was then calculated with the image correlation software Davis 7.0 (LaVision GmbH, Germany) to give in-plane shrinkages-longitudinal shrinkage εX and transverse shrinkage εY. The out-of-plane shrinkage strain εZ was assumed to be equal to the transverse shrinkage strain εY because in these two directions the shrinkage strain should be similar due to their comparable dimensions and boundary conditions. Thus, the volumetric shrinkage strain, εVolume, at a given distance along the specimen’s length was determined by
.
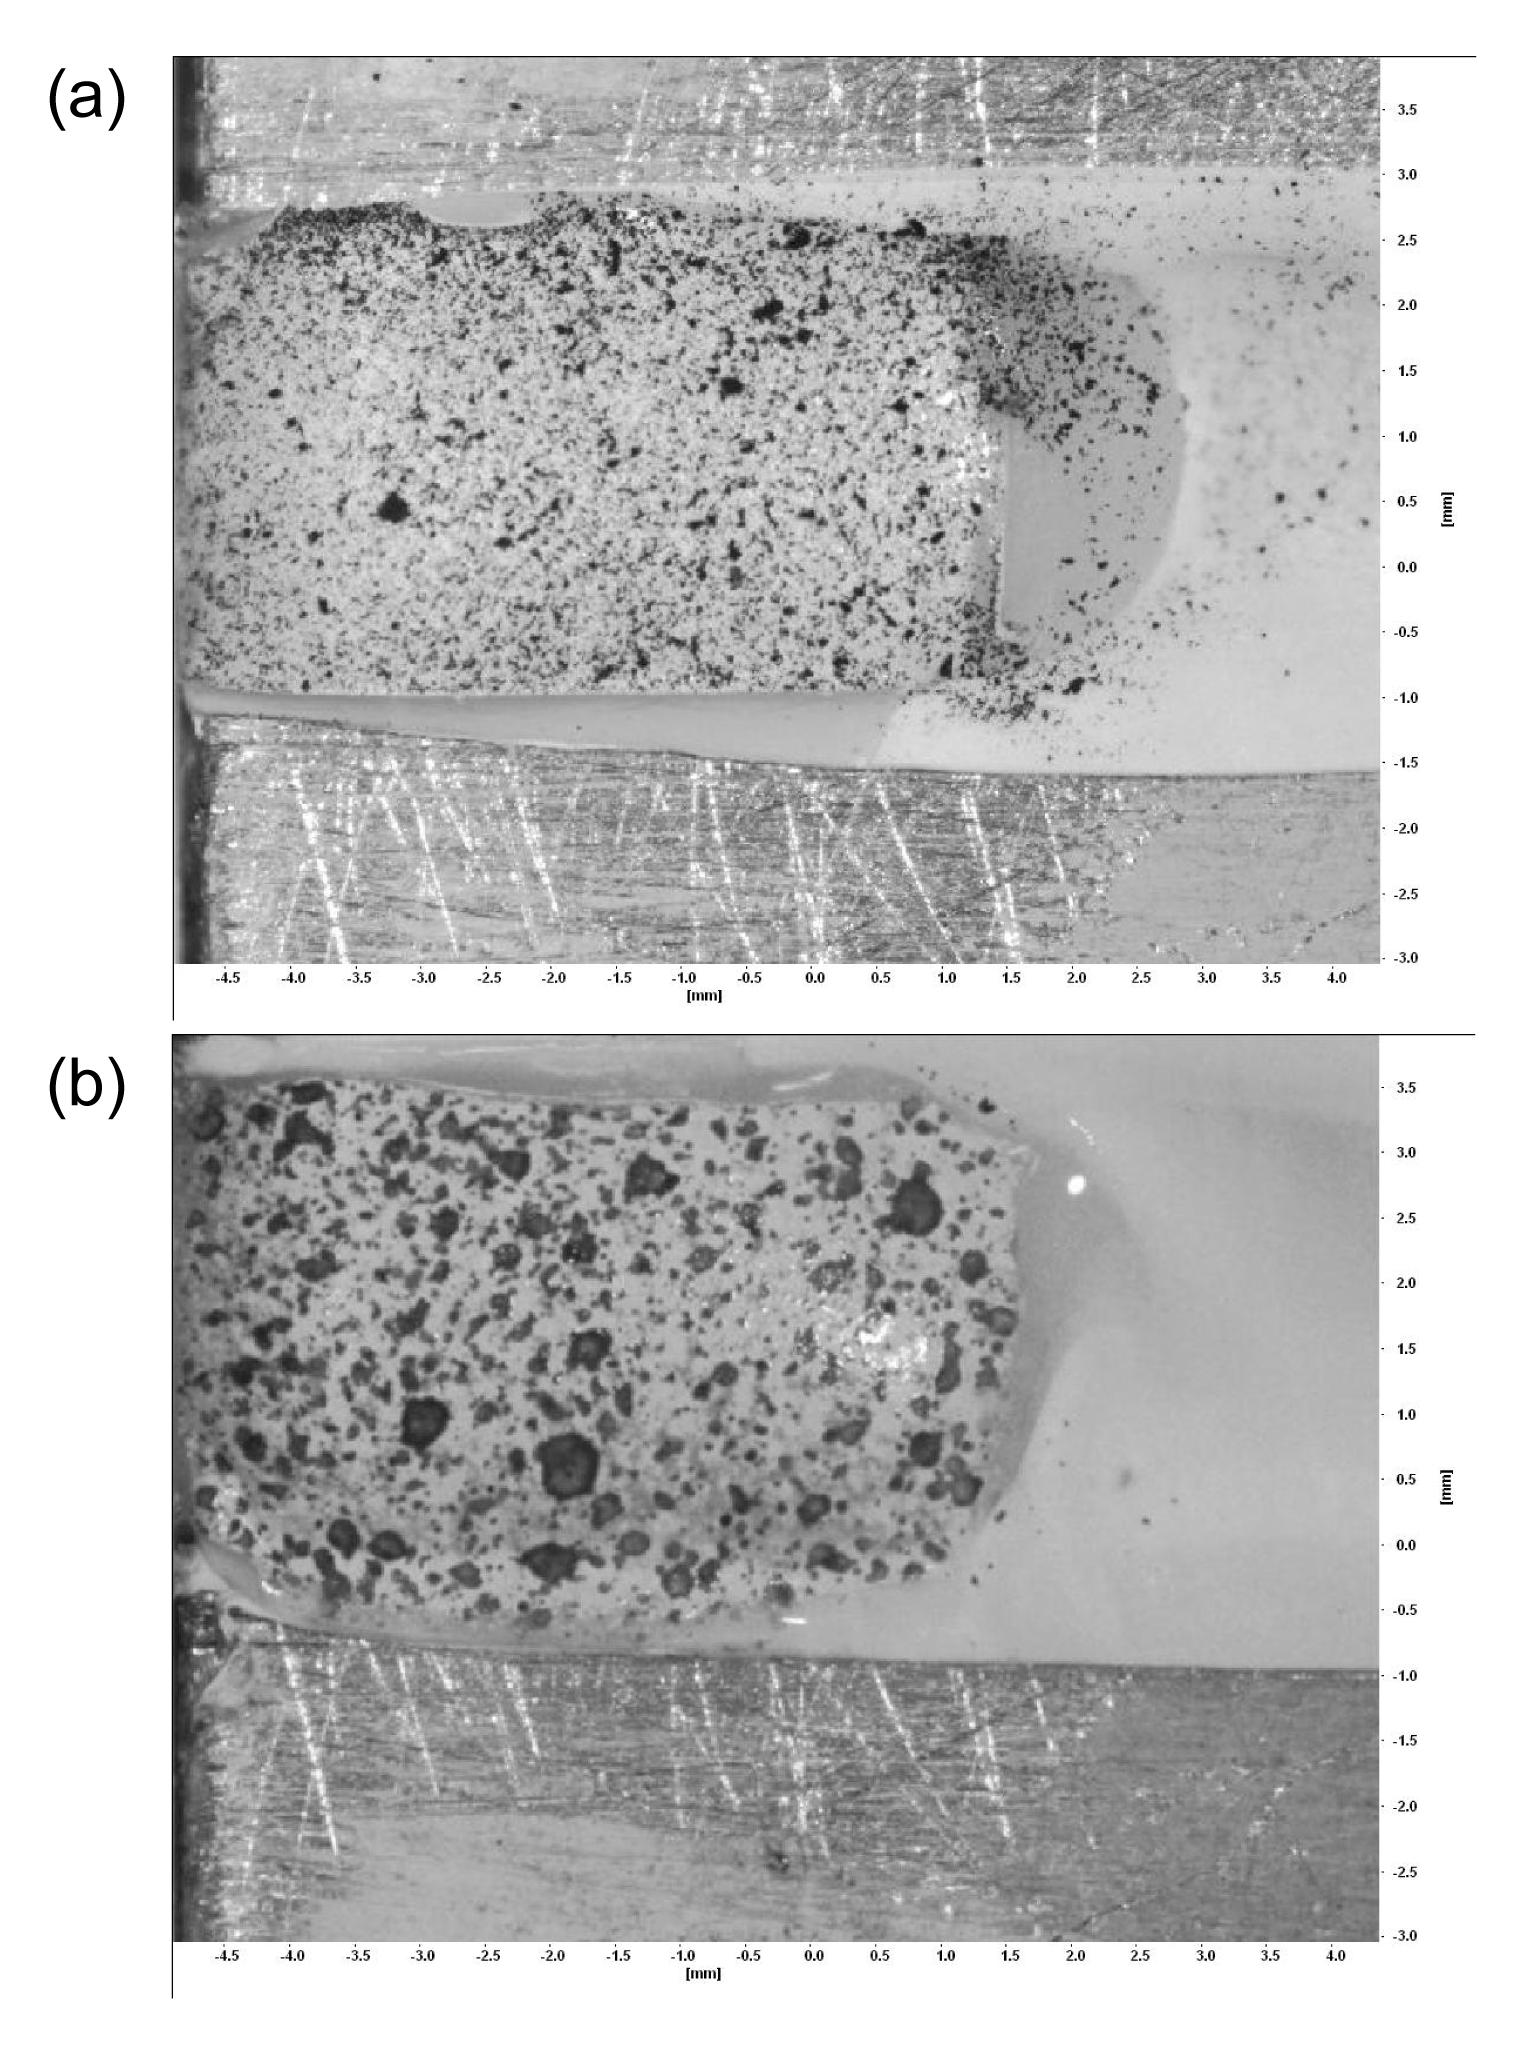
Besides shrinkage measurement, factors that may influence the accuracy of DIC system were also evaluated in this study. It should be noted that from then on shorter specimens with length around 5 mm, which is half length of the samples for shrinkage-depth study above, were used. One of those factors is the size of subset windows illustrated in Fig. 1 which must be given manually in the software. Smaller window size means that more displacement vectors can be obtained in the image and the result has more details. However, the size of a subset has to be large enough to include sufficient distinctive patterns so that it can distinguish itself from other subsets. The above two conflicting demands imply that there exists an optimal size of subset window. Thus, different subset window sizes, e.g., 64×64, 32×32 and 16×16 pixels, have been studied to see their effect on shrinkage strain measurement. Among them, the window size 32×32 was the one used in the shrinkage measurements for all the composite materials. Another factor, speckle size that determines how many distinguished patterns are included in the subset window, was also studied. Smaller speckle size was achieved by using nano-sized carbon powder spray as did in the measurement above and the larger speckle sizes were produced by coarse black spray paint. For comparison, two samples prepared with above two painting methods are shown in Fig. 3. In addition, other factors that have also been studied all together were brightness of illumination light and specimen length. The former influences the measurement by the images contrast and the latter may influence the shrinkage due to the constraint of other materials connected to it. Obviously, longer specimen shrinks more easily in transversal direction than it does in longitudinal direction.
Fig.3 Speckles created with fine carbon powder (a) and spray paint (b)
4. Results
4.1. Strain distribution and depth of cure
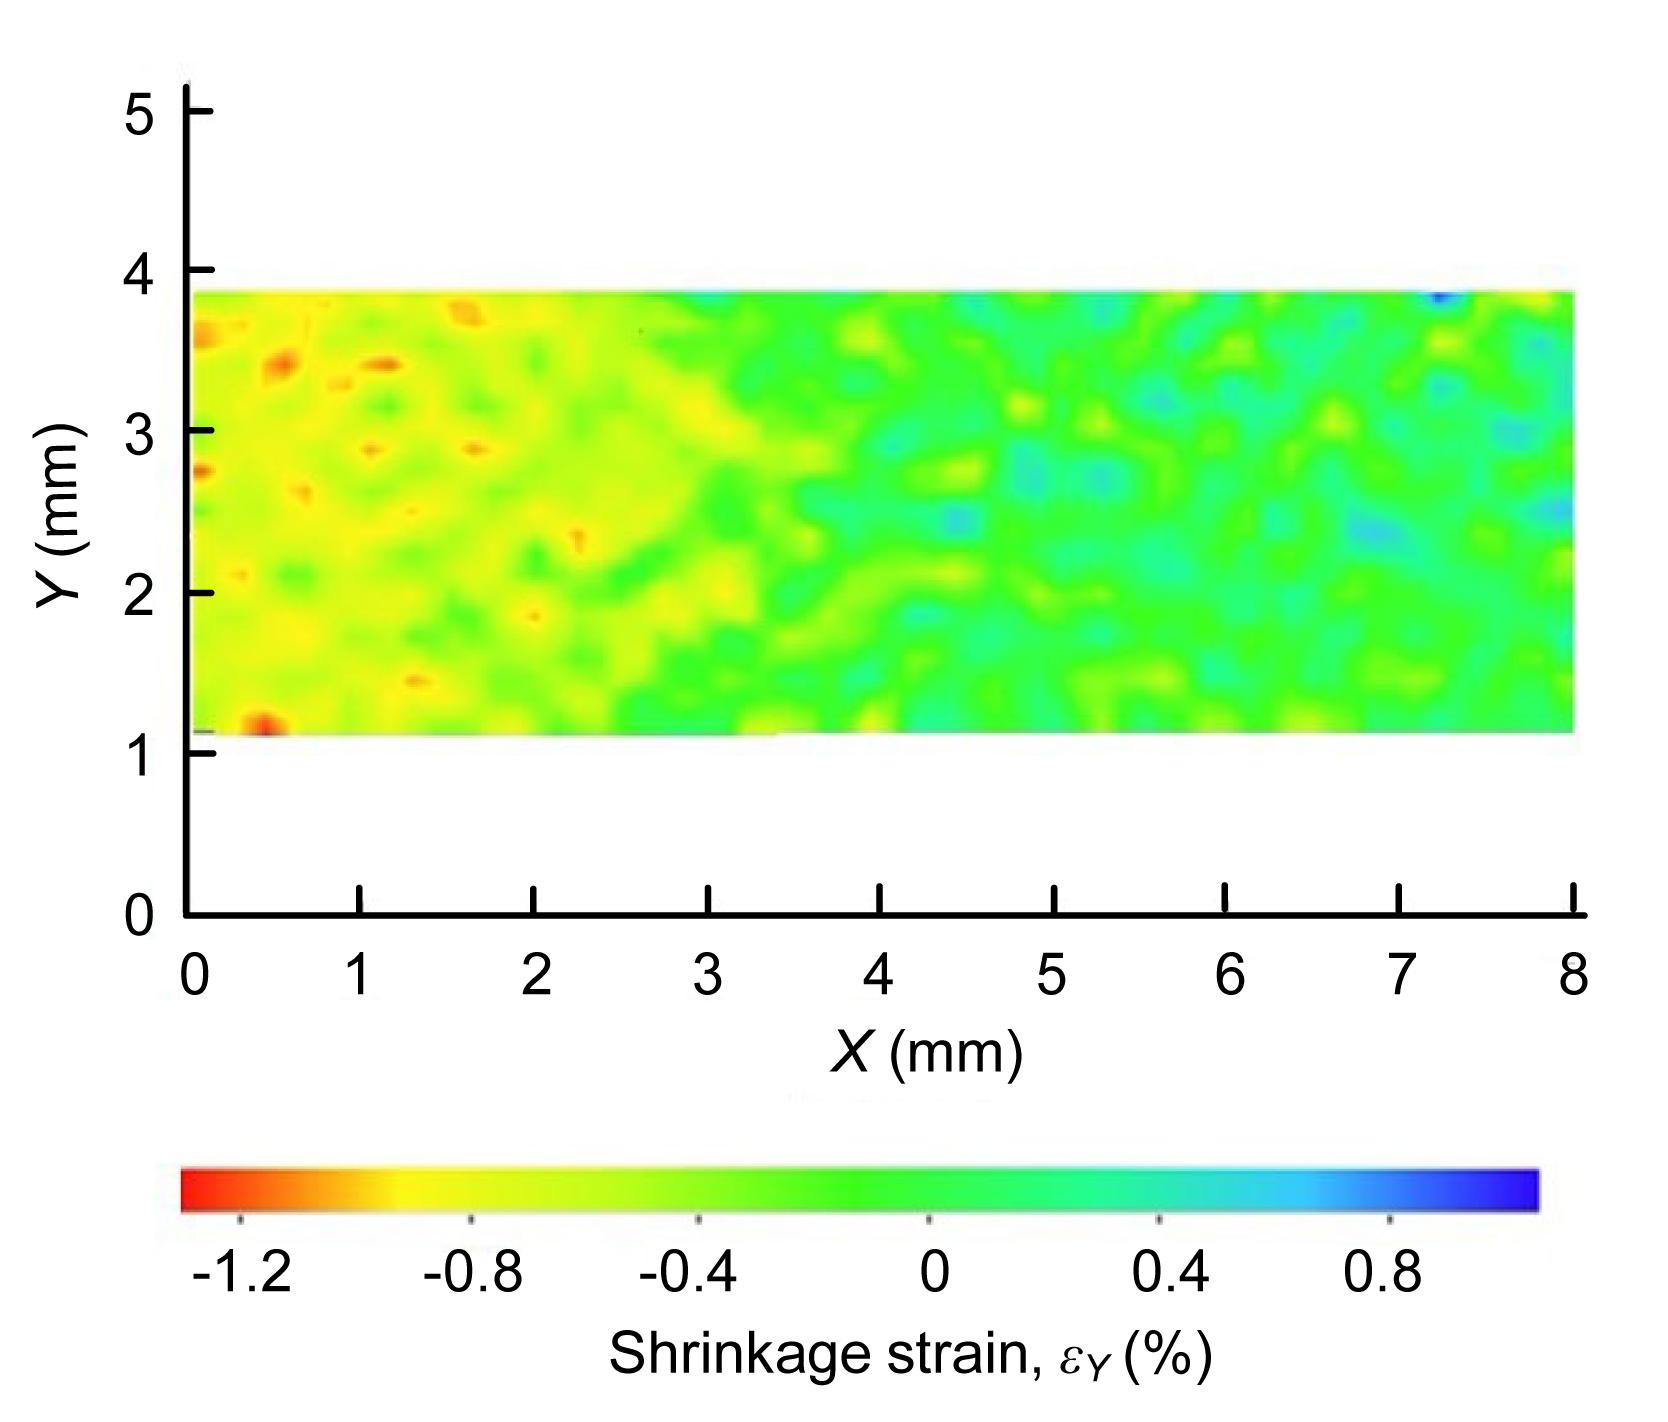
A typical transverse shrinkage field obtained for a Z250 composite specimen at 30 min after curing is shown in Fig. 4. It contained some local strain concentrations, indicating that polymerization of the material might not be uniform over the specimen, even at a constant depth from the irradiated surface. Nevertheless, the decreasing shrinkage strain with increasing distance from the left irradiated surface can clearly be seen. Thus, the average shrinkage strain over the height of each specimen was calculated at various points along its length, and the mean values and standard deviations for all the specimens of each material were calculated for comparison.
Fig.4 Transverse shrinkage strain contour from a representative specimen of the composite Z250, showing the 2D distribution of transverse shrinkage strains at 30 min after light curing. Irradiation was applied from the left side
The longitudinal shrinkage strain had a similar distribution, but the reduction with distance from the irradiated surface was larger and quicker.
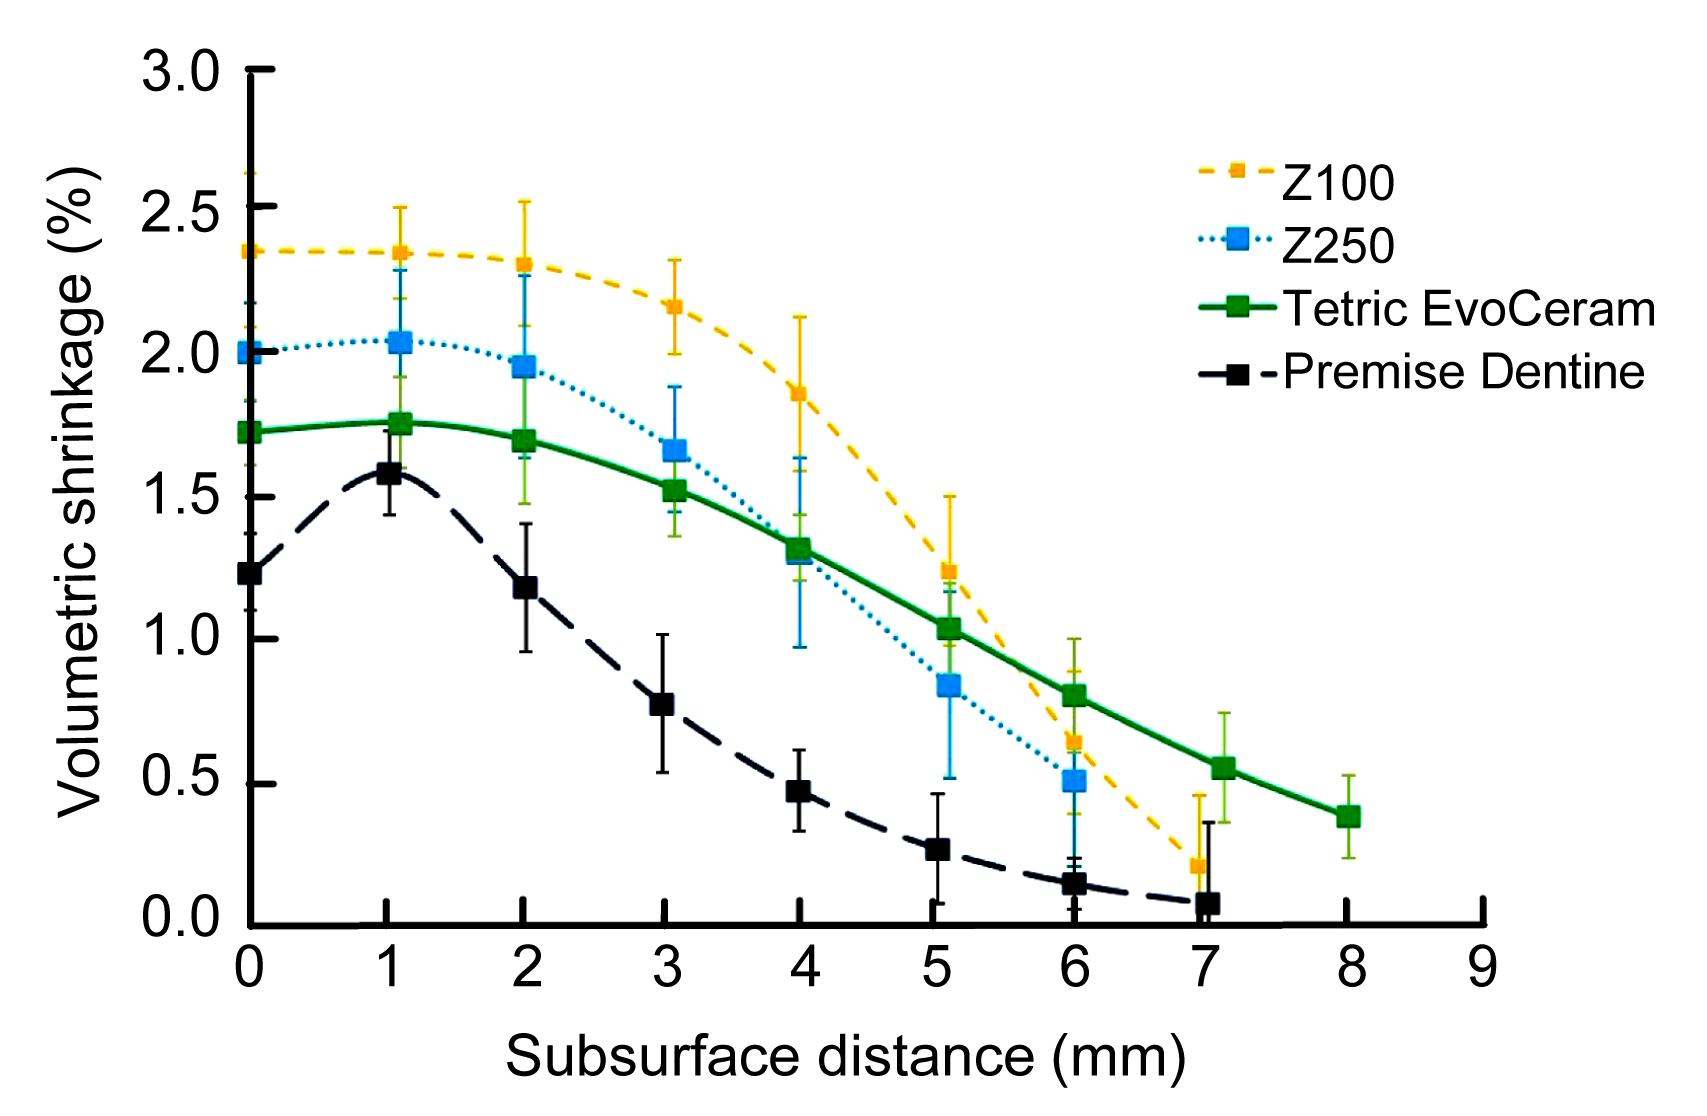
The mean volumetric shrinkage strains along the longitudinal distance from the irradiated surface at 30 min after curing are shown in Fig. 5 for different composite materials tested. Z100, Z250 and Tetric EvoCeram had similar shrinkage strain profiles, with a rather uniform value in the first 2 mm, followed by a gradual reduction, albeit at different rates, with respect to the depth. Amongst these four materials, Z100 had the greatest shrinkage strain values, followed by Z250, Tetric EvoCeram and then Premise Dentine. Interestingly, the maximum volumetric shrinkage of Premise Dentine did not occur at the irradiated surface, but at approximately 1 mm subsurface. This subsurface peak was less obvious in other materials. Although Premise Dentine had the lowest shrinkage strain, the rate at which its shrinkage reduced with distance was the fastest. Tetric EvoCeram, by contrast, showed the lowest rate of reduction.
Fig.5 Volumetric shrinkages for different composites as functions of distance from the irradiated surface at 30 min after curing. Standard deviations of the shrinkage values are shown with vertical bars
4.2. Effect of subset window size
Fig. 6 shows the effect of the subset window size on the calculated shrinkage strain fields. A subset window size of 64×64 pixels gave the smoothest contours of shrinkage strain, but some details in the heterogeneity of the material were lost when compared to those obtained with a size of 32×32 pixels, which appeared to be the optimum. In contrast, a subset window size of 16×16 pixels resulted in a lot of noise in the data, making it difficult to discern the general pattern in the strain distribution.
Fig.6 Shrinkage strain contours obtained using different subset window sizes of 64×64, 32×32 and 16×16 pixels
4.3. Effect of speckle size
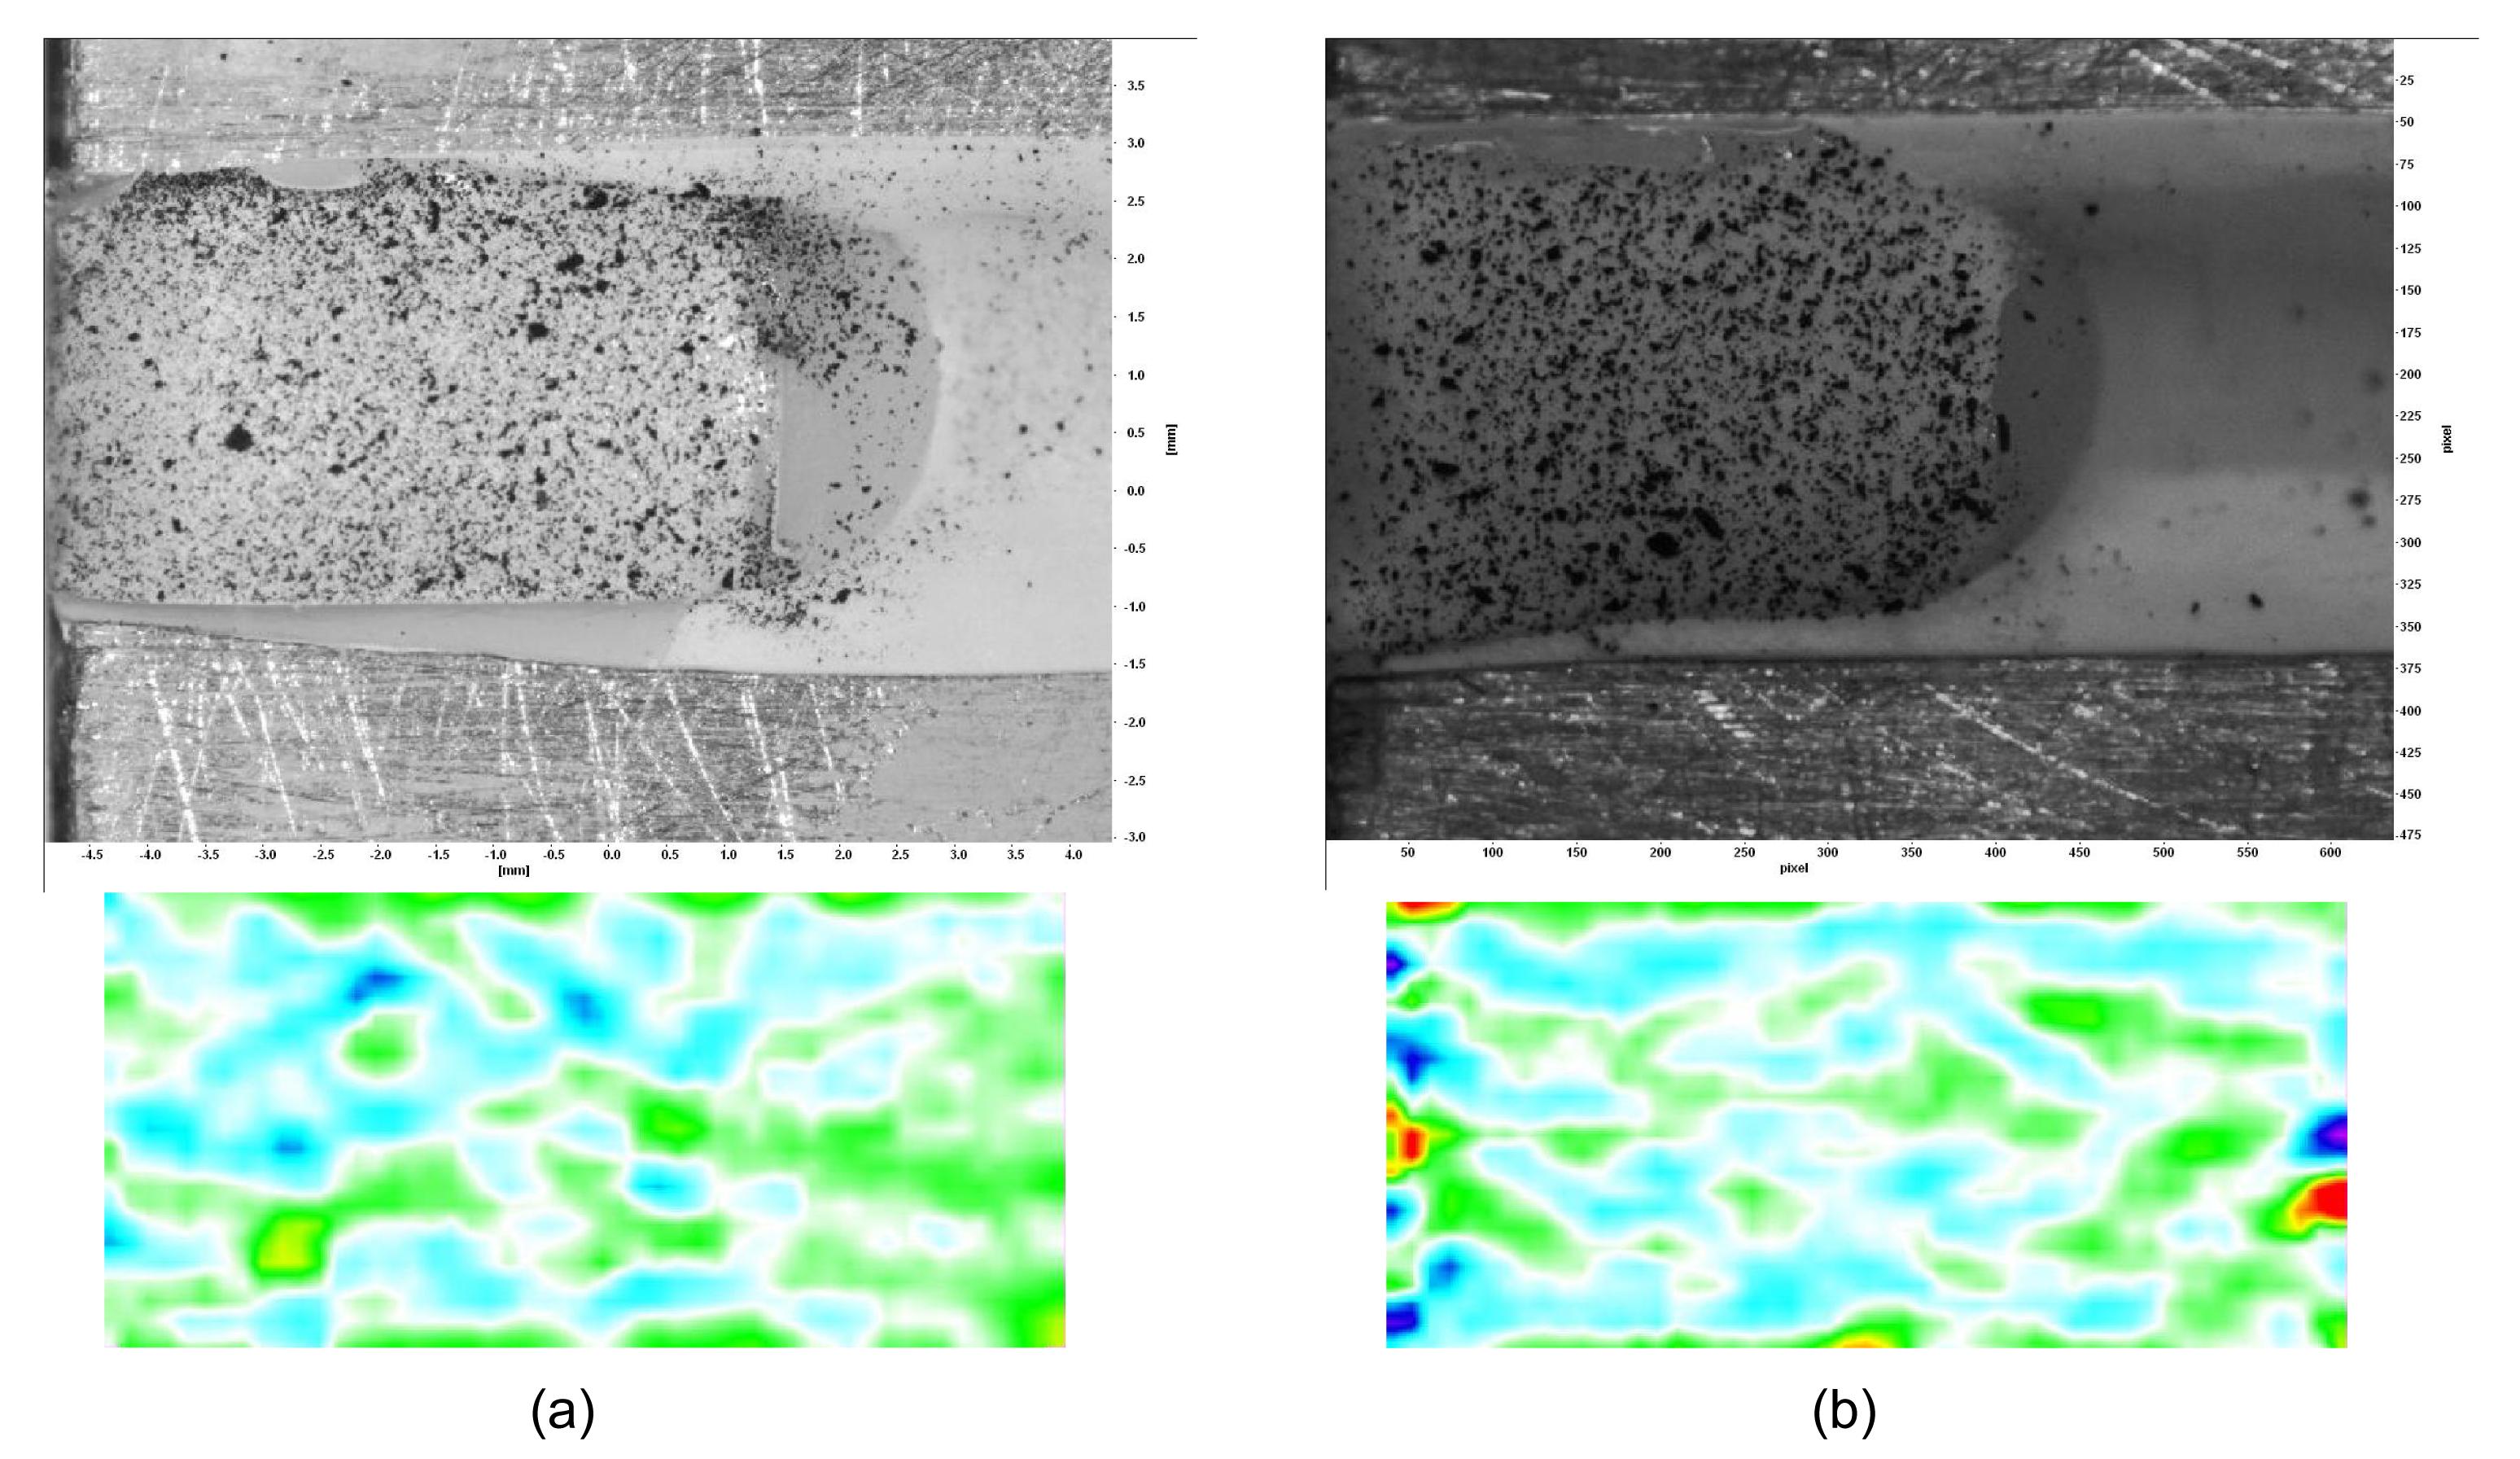
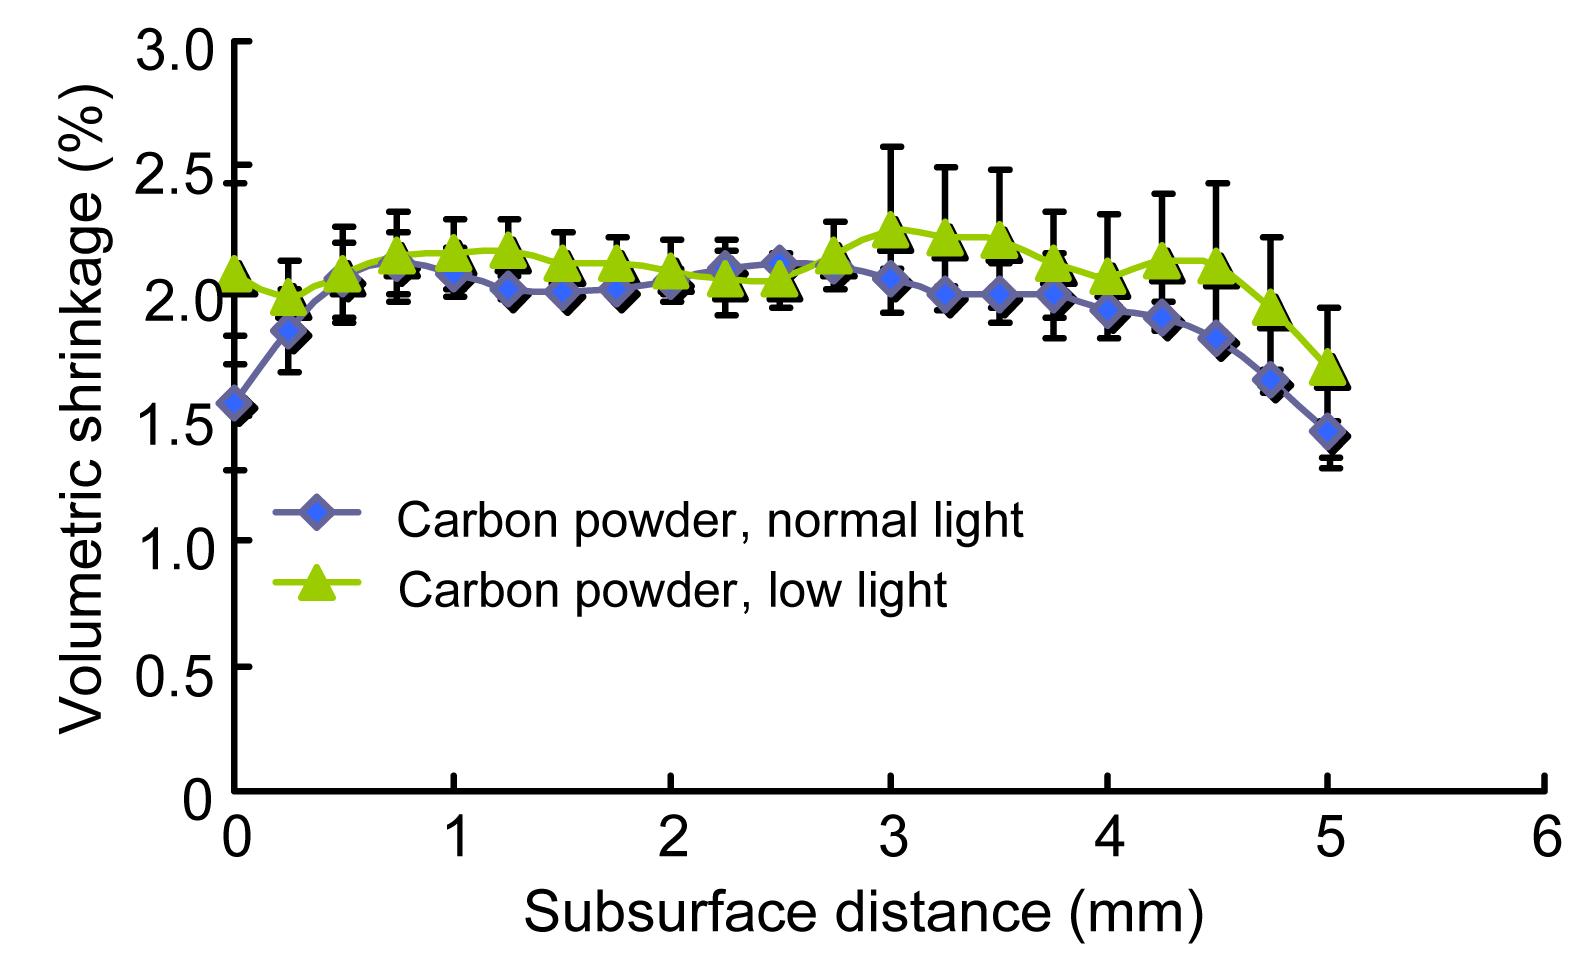
Fig. 7 shows the shrinkage strain of composite samples with speckle patterns created with fine carbon powder and spray paint, shown in Fig. 3. Note that these were shorter specimens than those shown in Figs. 4–6. The much larger speckle size produced by the spray paint can clearly be seen, and there appeared to be a higher level of noise or heterogeneity in the specimens prepared with this method. Despite this difference, the volumetric shrinkage strain distributions with subsurface distance given by the two sets of specimens were very similar, in terms of the values averaged over the specimen height (Fig. 8).
Fig.7 Shrinkage strain contours from Z100 samples painted with fine carbon powder (a) and spray paint (b)
Fig.8 Shrinkage strain distributions for Z100 samples painted with fine carbon powder and spray paint
4.4. Effect of lighting
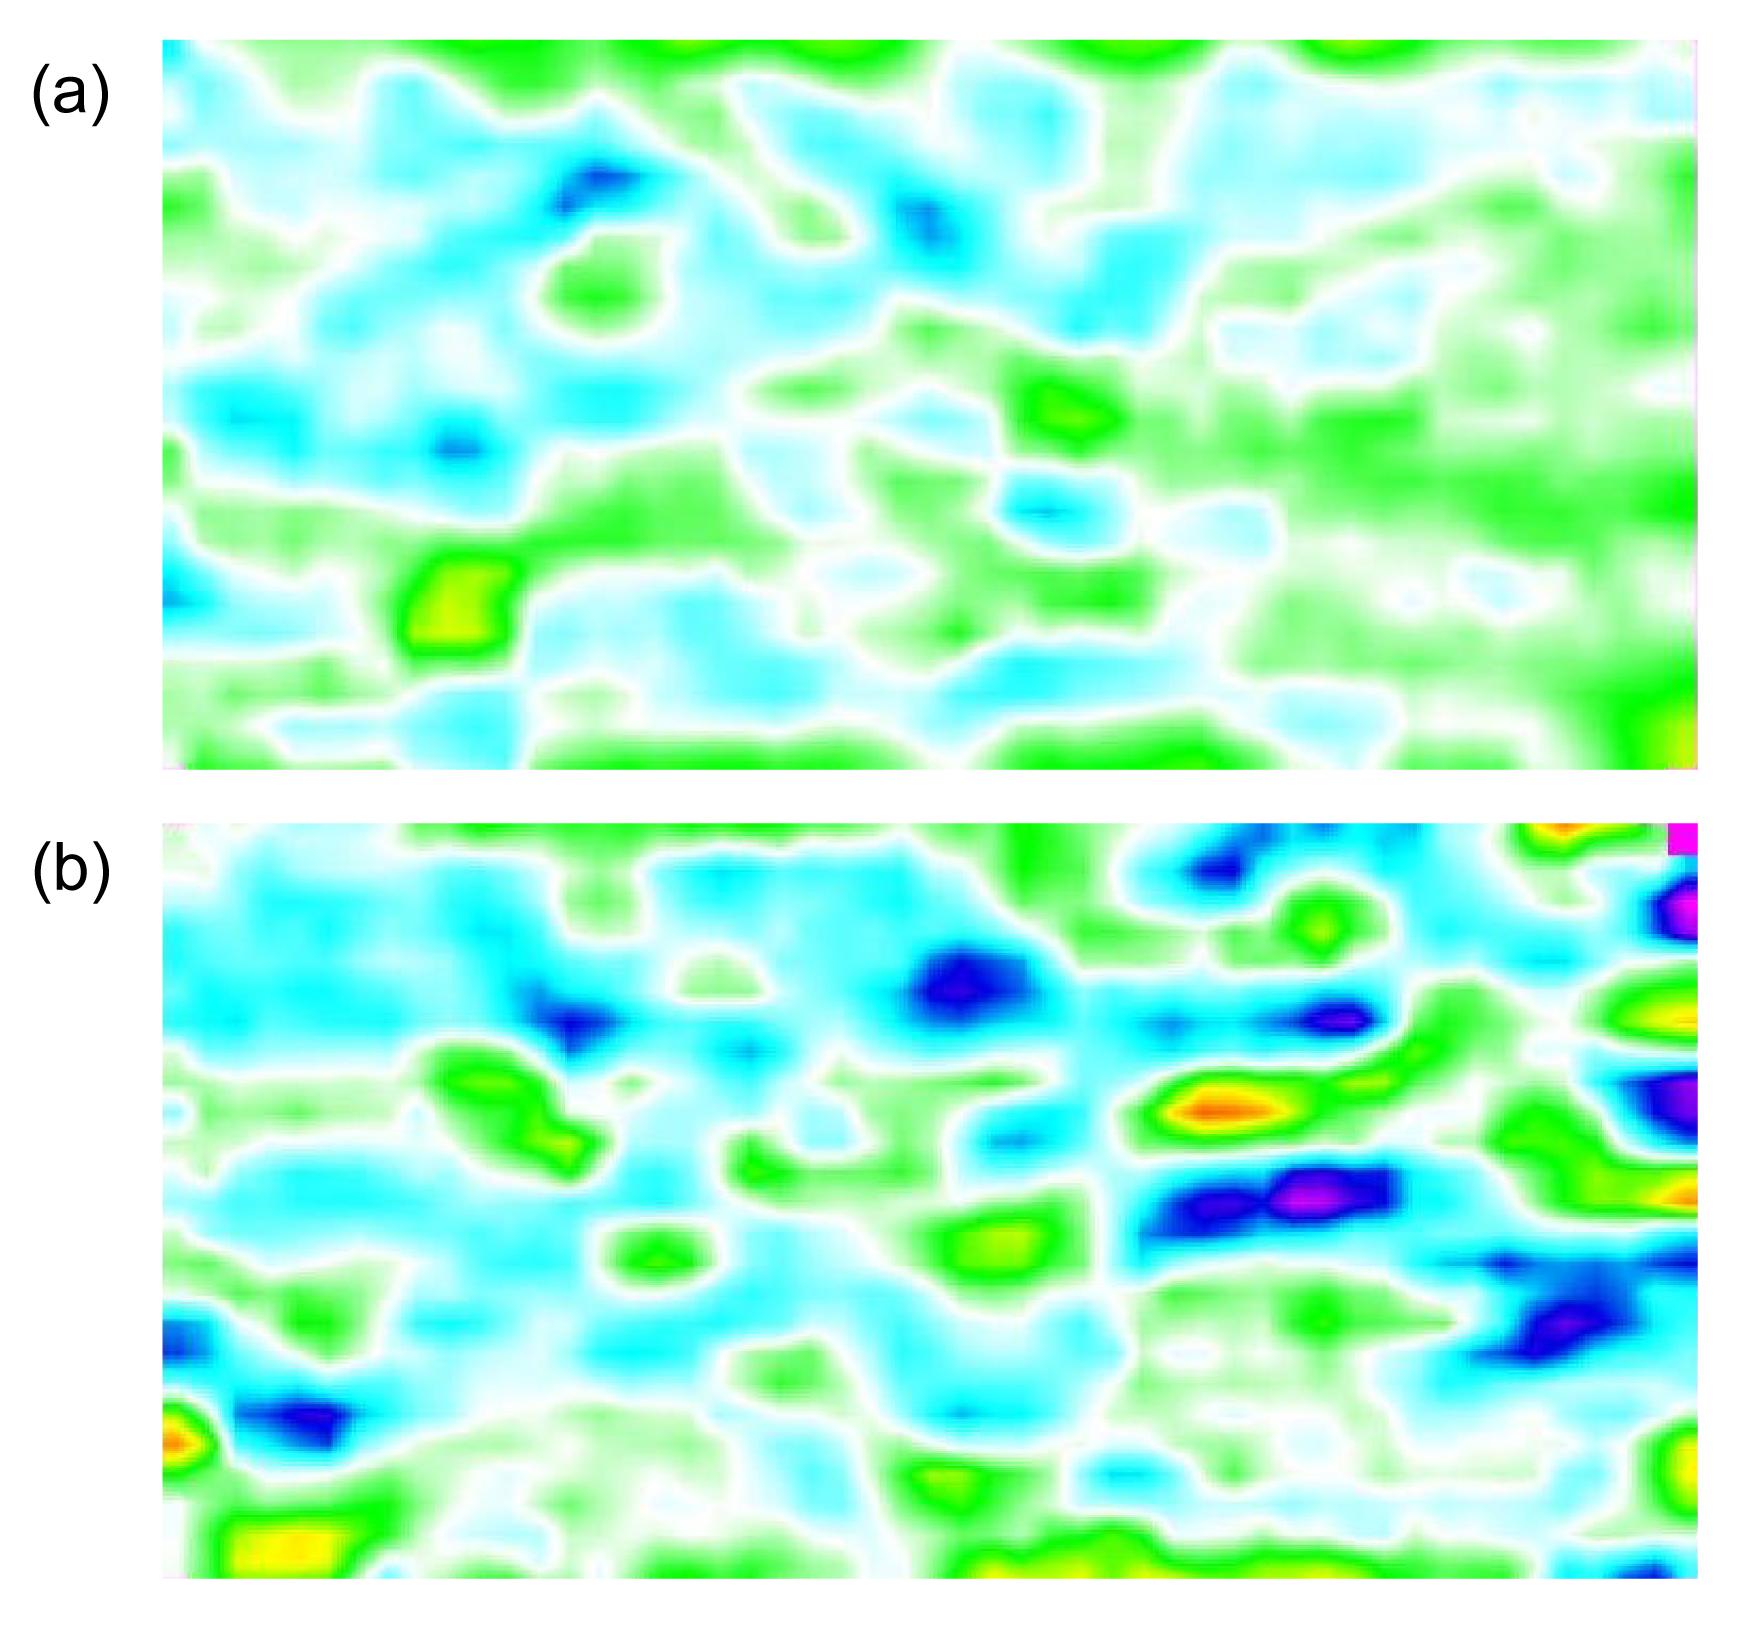
Fig. 9 shows two specimens illuminated with different lighting conditions. The speckles in both were created by fine carbon powder. While the average shrinkage strains at each subsurface distance were similar between the two, the ones obtained with dimmer lighting had larger standard deviations, indicating a higher level of noise, especially at the ends of the specimen (Fig. 10).
Fig.9 Specimens illuminated with different lighting conditions and resulting shrinkage strain contours (a) Bright; (b) Dim
Fig.10 Shrinkage strain distributions for Z100 given by specimens illuminated with different light conditions
4.5. Effect of specimen length
The results presented in the subsections 4.3 and 4.4 were obtained with specimens that were approximately half as long as those presented in earlier sections. While the average values of the shrinkage strain in the first few millimeters appeared to be independent of the specimen length, this was not the case for the values at deeper locations. The longer the specimen, the greater was the rate of reduction with distance from the irradiated surface, especially for the longitudinal strain. This can be seen by comparing Fig. 5 with Fig. 8 or Fig. 10.
5. Discussion
Compared to the other measurement methods described earlier, the image correlation method gave more detailed and useful information about the polymerization shrinkage behavior of dental composites, in particular the depth of cure. Note that under-cured composite will have inferior mechanical properties, such as low hardness, strength and wear resistance (Ferracane et al., 1998; Uhl et al., 2002; Versluis et al., 2004; Chen et al., 2005; Silva et al., 2007; Li et al., 2009b). The additional information provided by DIC can help decide the maximum depth of a restoration that is to be filled with a bulk-cured material or the maximum layer thickness of a restoration that is to be filled incrementally.
Polymerization shrinkage of the composites in Fig. 4 appeared to be non-uniform, as we have discovered previously (Li et al., 2009a). Contributing factors could be (1) heterogeneity in material composition leading to differences in the initiation and rate of polymerization, and (2) the presence of noise in the signals, especially at deep locations where shrinkage was low. In some of the composite specimens, maximum shrinkage did not occur at the irradiated surface, but at a depth of around 1 mm. Obici et al. (2006) obtained a similar spatial profile for the degree of conversion (DC) of the composite Z250, which was also tested in the current study. In their study, the maximum DC also occurred at a depth of 1 mm instead of the irradiated surface. They attributed this to oxygen inhibition of the polymerization process on the polymer surface. The same reason could have caused the lower shrinkage values at the irradiated surface as there is a one-to-one correspondence between DC and polymerization shrinkage.
The greater reduction in the longitudinal shrinkage strain with distance from the irradiated surface was attributed to the creation of counteracting tensile deformation in the same direction through inertial effects. As the material close to the curing light shrank, its movement was being resisted by the long tail of softer material that tended to stay behind. This difference in shrinkage may have created tensile deformation and canceled some of the shrinkage strain. The longer the specimen, the more pronounced the reduction in shrinkage, as shown by the comparison between Fig. 5 and Fig. 8 (or Fig. 10). In the transverse and out-of-plane directions, because of the much smaller dimensions and the more uniform shrinkage values across the sections, no counteracting tensile deformation was expected.
The polymerization shrinkage seemed to approach the zero value asymptotically with increasing subsurface distance (Fig. 5). The small shrinkage strain at the very deep position of each composite was considered to be induced by the background room light and/or the illumination light. To test this, an additional Premise Dentine specimen was cured using the illumination light only. The results confirmed that a small amount of shrinkage could be produced by the illumination light and the resulting volumetric shrinkage strain ranged from 0.1% to 0.3% along the specimen length.
To ensure accuracy in the shrinkage measurement with a DIC system, attention should be paid to certain aspects of the experimental procedures. Firstly, a flat specimen surface with irregular speckles is required and the deformation to be measured should occur predominantly within the plane where the specimen surface is located. Secondly, a suitable illumination light should be used. If it is too bright, light reflection on the specimen surface can mask the speckles. On the other hand, if it is too dim, the signal-to-noise ratio will become low. Thirdly, the size of the subset windows determines the number of displacement vectors that can be obtained from the recorded images. More subset windows mean more shrinkage strain details can be identified in the result, and this is recommended if there is a high strain gradient in the specimen. However, this can also introduce more noise to the results because each subset may not include enough information for accurate displacement tracking and calculation. The selection of subset window size also depends on the shrinkage (or displacement) level of the specimen and the size of speckles. The lower the displacement level and the smaller the speckle size, the smaller the subset windows should be. It is always worthwhile to try different window sizes to find an optimal one for the particular problem in hand.
Shrinkage in the out-of-plane direction could potentially affect measurement of the in-plane strains, because the resulting increased distance of the specimen from the camera could scale down the image of the specimen, giving the false impression that the material had shrunk more than it actually had in the in-plane directions. However, out-of-plane movement cannot be quantified unless two or more cameras are used. Thus, to assess the influence of the out-of-plane shrinkage on the in-plane shrinkage measurement, a test was carried out with a steel square block of sides 30 mm by 30 mm, which was also painted in the same way and located at the same nominal position as the composite specimen (Li et al., 2009a). The steel block was placed on a movable platform controlled by a micrometer, which allowed the platform to be moved manually in small steps of 0.01 mm away from the camera. The steel block was moved through a total distance of 0.1 mm. As the thickness of the composite specimen was 2 mm, this represented an out-of-plane shrinkage of 5%. The image of the specimen was recorded at each step, and the result showed that the 0.1 mm movement of the recording surface resulted in a false in-plane shrinkage of 0.05%. This represented only 1% of the true shrinkage value. Therefore, the influence of the out-of-plane shrinkage on the in-plane values could be ignored.
6. Conclusions
The DIC method has been introduced as a non-contact optical technique for measuring the polymerization shrinkage of dental composites. The method to calculate the volumetric shrinkage with a single-camera, 2D measurement system has been presented, and factors that can affect the accuracy of the measurements have been discussed. Overall, the DIC method has the advantage of providing more detailed and useful information on the shrinkage behavior of dental composites. This allows more informed decisions to be made in the selection of appropriate materials and placement techniques for restoring decayed or damaged teeth.
References
[1] Arenas, G., Noriega, S., Vallo, C., Duchowicz, R., 2007. Polymerization shrinkage of a dental resin composite determined by a fiber optic Fizeau interferometer. Optics Communications, 271(2):581-586.
[2] Chen, Y.C., Ferracane, J.L., Prahl, S.A., 2005. A pilot study of a simple photon migration model for predicting depth of cure in dental composite. Dental Materials, 21(11):1075-1086.
[3] de Gee, A.J., Davidson, C.L., Smith, A., 1981. A modified dilatometer for continuous recording of volumetric polymerization shrinkage of composite restorative materials. Journal of Dentistry, 9(1):36-42.
[4] Demoli, N., Knezevic, A., Tarle, Z., Meniga, A., Sutalo, J., Pichler, G., 2004. Digital interferometry for measuring of the resin composite thickness variation during blue light polymerization. Optics Communications, 231(1-6):45-51.
[5] Fano, V., Ortalli, I., Pizzi, S., Bonanini, M., 1997. Polymerization shrinkage of microfilled composites determined by laser beam scanning. Biomaterials, 18(6):467-470.
[6] Ferracane, J.L., Berge, H.X., Condon, J.R., 1998. In vitro aging of dental composites in water—Effect of degree of conversion, filler volume, and filler/matrix coupling. Journal of Biomedical Materials Research, 42(3):465-472.
[7] Fogleman, E.A., Kelly, M.T., Grubbs, W.T., 2002. Laser interferometric method for measuring linear polymerization shrinkage in light cured dental restoratives. Dental Materials, 18(4):324-330.
[8] Heise, M., Krger, U., Rckert, R., Pfitzman, R., Neuhaus, P., Settmacher, U., 2003. Correlation of intimal hyperplasia development and shear stress distribution at the distal end-side-anastomosis, in vitro study using particle image velocimetry. European Journal of Vascular and Endovascular Surgery, 26(4):357-366.
[9] Hbsch, P.F., Middleton, J., Feilzer, A.J., 1999. Identification of the constitutive behaviour of dental composite cements during curing. Computer Methods in Biomechanics and Biomedical Engineering, 2(4):245-256.
[10] Kang, J., Ososkov, Y., Embury, J.D., Wilkinson, D.S., 2007. Digital image correlation studies for microscopic strain distribution and damage in dual phase steels. Scripta Materialia, 56(11):999-1002.
[11] Lee, I.B., Cho, B.H., Son, H.H., Um, C.M., Lim, B.S., 2006. The effect of consistency, specimen geometry and adhesion on the axial polymerization shrinkage measurement of light cured composites. Dental Materials, 22(11):1071-1079.
[12] Li, J.Y., Fok, A.S.L., Satterthwaite, J., Watts, D.C., 2009. Measurement of the full-field polymerization shrinkage and depth of cure of dental composites using digital image correlation. Dental Materials, 25(5):582-588.
[13] Li, J.Y., Li, H., Fok, A.S.L., Watts, D.C., 2009. Multiple correlations of material parameters of light-cured dental composites. Dental Materials, 25(7):829-836.
[14] Obici, A.C., Sinhoreti, M.A.C., Frollini, E., Sobrinho, L.C., de Goes, M.F., Henriques, G.E.P., 2006. Monomer conversion at different dental composite depths using six light-curing methods. Polymer Testing, 25(3):282-288.
[15] Palin, W.M., Fleming, G.J.P., Nathwani, H., Burke, F.J.T., Randall, R.C., 2005. In vitro cuspal deflection and microleakage of maxillary premolars restored with novel low-shrink dental composites. Dental Materials, 21(4):324-335.
[16] Sakaguchi, R.L., Sasik, C.T., Bunczak, M.A., Douglas, W.H., 1991. Strain gauge method for measuring polymerization contraction of composite restoratives. Journal of Dentistry, 19(5):312-316.
[17] Sakaguchi, R.L., Versluis, A., Douglas, W.H., 1997. Analysis of strain gage method for measurement of post-gel shrinkage in resin composites. Dental Materials: Official Publication of the Academy of Dental Materials, 13(4):233-239.
[18] Sakaguchi, R.L., Wiltbank, B.D., Shah, N.C., 2004. Critical configuration analysis of four methods for measuring polymerization shrinkage strain of composites. Dental Materials, 20(4):388-396.
[19] Sharp, L.J., Choi, I.B., Lee, T.E., Sy, A., Suh, B.I., 2003. Volumetric shrinkage of composites using video-imaging. Journal of Dentistry, 31(2):97-103.
[20] Silva, F.F., Mendes, L.C., Ferreira, M., Benzi, M.R., 2007. Degree of conversion versus the depth of polymerization of an organically modified ceramic dental restoration composite by Fourier transform infrared spectroscopy. Journal of Applied Polymer Science, 104(1):325-330.
[21] Sun, J., Lin-Gibson, S., 2008. X-ray microcomputed tomography for measuring polymerization shrinkage of polymeric dental composites. Dental Materials, 24(2):228-234.
[22] Uhl, A., Mills, R.W., Vowles, R.W., Jandt, K.D., 2002. Knoop hardness depth profiles and compressive strength of selected dental composites polymerized with halogen and LED light curing technologies. Journal of Biomedical Materials Research, 63(6):729-738.
[23] Versluis, A., Tantbirojn, D., Douglas, W.H., 2004. Distribution of transient properties during polymerization of a light-initiated restorative composite. Dental Materials, 20(6):543-553.
[24] Watts, D.C., Cash, A.J., 1991. Determination of polymerization shrinkage kinetics in visible-light-cured materials: methods development. Dental Materials: Official Publication of the Academy of Dental Materials, 7(4):281-287.
Open peer comments: Debate/Discuss/Question/Opinion


Open peer comments: Debate/Discuss/Question/Opinion
<1>