1. Introduction
The construction of twin tunnels in close proximity to each other has recently become more popular in urban environments. In some cases, twin tunnels are stacked over each other to avoid the pile foundations of existing buildings on the ground surface.
As far as the excavation of mechanized twin tunnels in close proximity is concerned, most cases reported in previous studies have focused on the interactions between two horizontally driven tunnels, using physical tests (Kim,
1996; Chapman et al.,
2007; Choi and Lee,
2010; He et al.,
2012; Ng et al.,
2013; Ng,
2014; Ng and Lu,
2014), field measurements (Yamaguchi et al.,
1998; Suwansawat and Einstein,
2007; Chen et al.,
2011; Zhou et al.,
2012; Ocak,
2013), empirical/analytical methods (Wang et al.,
2003; Hunt,
2005; Suwansawat and Einstein,
2007; Yang and Wang,
2011), and numerical analyses (Yamaguchi et al.,
1998; Hefny et al.,
2004; Zheng and Qiu,
2005; Karakus et al.,
2007; Hage Chehade and Shahrour,
2008; Afifipour et al.,
2011; Chakeri et al.,
2011; Ercelebi et al.,
2011; Mahmutoğlu,
2011; Channabasavaraj and Vishwanath,
2012; Hasanpour et al.,
2012; Li et al.,
2012; Do et al.,
2014b;
2014d). However, less work has been devoted to the interactions between tunnels stacked over each other (Yamaguchi et al.,
1998; Hefny et al.,
2004; Suwansawat and Einstein,
2007; Hage Chehade and Shahrour,
2008; Liu et al.,
2008; Channabasavaraj and Vishwanath,
2012; Li et al.,
2012).
A series of 3D centrifuge model tests were used to investigate the effects of twin tunnel construction in dry sand (Ng et al.,
2013; Ng and Lu,
2014). An important impact of the tunnel construction procedure on the movements of the ground surrounding the tunnels was highlighted through the changes in the internal forces induced in the existing piles and through the settlement curves.
Yamaguchi et al. (
1998) divided the interactions between two tunnels into three stages: Stage 1, the subsequent shield approaches the measuring point and its thrust begins to have an influence; Stage 2, the tail of the subsequent shield passes the measuring point and the influence of the falling pressure after excavation can be observed; and Stage 3, the subsequent shield moves away and ceases to have any influence. Unfortunately, only the tunnel bending moment and the earth pressures measured in an existing tunnel when subsequent shields passed were dealt with in this work.
Suwansawat and Einstein (
2007) introduced a superposition technique to describe surface settlement troughs over twin tunnels, and dealt with cases of two horizontal tunnels driven in parallel and of stacked tunnels. In general, the superposition technique cannot rigorously take into account the effect of an existing tunnel or the unloading of the ground due to the excavation of the preceding tunnel. Therefore, the settlement curves are not able to represent the final displacement very well (Divall et al.,
2012).
Hefny et al. (
2004), Hage Chehade and Shahrour (
2008), and Channabasavaraj and Vishwanath (
2012) presented 2D numerical analyses, which showed the influence of the position of a new tunnel on the behaviour of an existing tunnel. Hage Chehade and Shahrour (
2008) and Channabasavaraj and Vishwanath (
2012) indicated that the construction of an upper tunnel first leads to a greater settlement and greater structural forces than those obtained when the lower tunnel is constructed first.
Li et al. (
2012) presented a series of 3D numerical simulations of the interactions between two shield tunnels, in which the ground behaviour was modelled using the Mohr-Coulomb constitutive model. Particular attention was paid to the influence of the relative position of the two parallel tunnels. A case of stacked tunnels, in which the upper tunnel was driven first, was presented. Unfortunately, the existence of joints in the segmental lining and the construction loads during shield tunnelling, i.e., the face pressure, the jacking force, and the grouting pressure, were not simulated in this numerical model. Moreover, the impacts of a new tunnel excavation on an existing tunnel during the advancement of the new tunnel and of the surface settlements developed above the stacked tunnels were not considered.
Zhang and Huang (
2014) performed a simplified theoretical analysis and 3D finite element numerical simulations to investigate the influence of multiline overlapped tunnelling on existing tunnels. New twin stacked tunnels were excavated above and below existing horizontal tunnels. Deformation analyses of existing subway tunnels were conducted.
At present, there is no complete 3D numerical simulation for mechanized twin stacked tunnel excavation in soft ground that is able to allow both ground displacement and structural lining forces to be considered. The aim of this study was to provide such a simulation, using a strain hardening constitutive model, the Cap-Yield soil (CYsoil) model (ITASCA,
2009). Most of the main elements of mechanized tunnelling are simulated in this model.
2. Numerical model
2.1. Three-dimensional numerical model
Parameters from the Bologna-Florence high speed railway line project, which is a part of the Italian high speed railway network, were used in this study as a reference case. The twin horizontal tunnels, separated by a distance of 15 m between the two tunnel centers, each has an external excavation diameter of 9.4 m and an internal diameter of 8.3 m. The two tunnels were excavated at a depth of between 15 m and 25 m below the ground surface, through alluvial deposits of the late Pleistocene–Pliocene era, mostly from the Savena River, and deposits of clay and sandy soil (clayey sands and Pliocene clay). Some typical parameters of the ring 582 section were adopted in this study (Do et al.,
2014a;
2014b).
The CYsoil model (ITASCA,
2009), a strain hardening constitutive model, was used. This model is characterized by a frictional Mohr-Coulomb shear envelope (zero cohesion) and an elliptic volumetric cap in the (
p′,
q) plane, where
p′ is the mean effective stress, and
q is a measure of shear stress (ITASCA,
2009). Stiffness is adopted as a function of the effective confinement, which leads to a higher value for unloading-reloading stiffness. Parameters of the soil are presented in Table
1.
Table 1
Parameters of the CYsoil model (Do et al.,
2014a)
| Parameter |
Value |
Reference elastic tangent shear modulus,  (MPa) (MPa) |
58 |
Elastic tangent shear modulus, G
e (MPa), \]
) *
*
|
98 |
Elastic tangent bulk modulus, K
e (MPa), \]
)
|
213 |
| Reference effective pressure, p
ref (kPa) |
100 |
| Failure ratio, R
f
|
0.9 |
| Ultimate friction angle, ϕ
f (°) |
37 |
| Calibration factor, β
|
2.35 |
*
σ
3 is the effective pressure
The numerical model, the 3D simulation procedure for a mechanized tunnel, and the parameter calibration of the CYsoil model are described by Do et al. (
2014a;
2014b;
2014d). Therefore, only a short overview is given here.
The excavation process of the tunnel was simulated using a step-by-step approach. The length of each advance of the tunnel face of 1.5 m is equal to the width of a lining ring.
Pressure applied from the shield chamber to the tunnel face was estimated on the basis of the horizontal stress induced in the ground in front of the tunnel face (Mollon et al.,
2013), taking into consideration the change in depth of each stacked tunnel. Values of the horizontal pressures applied from the shield chamber to each tunnel face were calculated on the basis of the vertical stress measured directly in front of each tunnel face after each excavation step. This face pressure distribution was applied to the excavation face using a trapezoidal profile to account for the slurry density. In addition to the face pressure, another pressure was applied to the cylindrical surface just behind the tunnel face to take into account any possible slurry migration. The shield machine was simulated using the “fictive” shield introduced by Dias et al. (
2000), Jenck and Dias (
2004), and Mollon et al. (
2013).
Vertical loads, applied to the bottom region of the tunnel over an assumed range of 90° at the cross-section and over the whole length of the shield, were used to simulate the self-weight of the shield.
The distribution of the jacking force, which acts on segments of the last ring, was assumed to be linear over the height of the tunnel. Jacking forces were set on three plates located at 1/6, 1/2, and 5/6 of the segment length for each segment.
The grouting action was modelled in two phases: (1) the liquid state (state 1), which is represented by a certain pressure; (2) the solid state (state 2). A radial pressure was used to simulate this kind of pressure. The grouting pressure was estimated considering the ground overburden pressure at the crown of each stacked tunnel based on the proposal by Mollon et al. (
2013). A grouting pressure distribution was simulated, taking into account the effect of gravity, over a length of 1.5 m behind the shield. A triangular pressure was also modelled over the length of one ring (1.5 m) in front of the shield tail to consider the migration of the grout. The grout was assumed to be hardened beyond this length, and was simulated by means of volume elements with perfect elastic behaviour, and with the following elastic characteristics: Young’s modulus
E
grout=10 MPa and Poisson’s ratio
ν
grout=0.22 (Dias and Kastner,
2013; Mollon et al.,
2013; Do et al.,
2014c). The tunnel segments were simulated using a linear-elastic embedded liner element. The tunnel lining parameters are presented in Table
2. The stiffness parameters of the joint connection were taken into consideration by means of a set composed of a rotational spring (
K
&thgr;), an axial spring (
K
A), and a radial spring (
K
R) (Do et al.,
2013;
2014a;
2014b;
2014c). Similarly, the rigidity characteristics of the ring joint connection were represented by a set composed of a rotational spring (
K
&thgr;R), an axial spring (
K
AR), and a radial spring (
K
RR).
Table 2
Properties of the tunnel lining (Do et al.,
2014a)
| Parameter |
Value |
| Young’s modulus, E
l (GPa) |
35 |
| Poisson’s ratio, ν
l
|
0.15 |
| Lining thickness, t
l (m) |
0.4 |
| External diameter, D (m) |
9.4 |
| Concrete lining density, γ
l (kN/m3) |
23 |
| Width of lining ring, w (m) |
1.5 |
A total weight of 3980 kN was simulated for the back-up train through the vertical loads, which act on the lining elements in the bottom region of the tunnel over an assumed angle of 90° in the cross-section and over a tunnel length of 72 m behind the shield tail (Kasper and Meschke,
2004). All the numerical calculations were conducted assuming drained conditions, without considering the presence of underground water.
2.2. Mechanized twin stacked tunnel simulation procedure
The twin stacked tunnel excavation was modelled as follows:
Case 1: (i) excavation of the upper tunnel first; (ii) excavation of the lower tunnel at a lagged distance
L
F=10
D behind the first tunnel face.
Case 2: (i) excavation of the lower tunnel first; (ii) excavation of the upper tunnel at a lagged distance
L
F=10
D behind the first tunnel face.
Case 3: simultaneous excavation of the upper and lower tunnels, i.e., a lagged distance of
L
F=0
D is adopted.
The two cases of
L
F=10
D, which commonly occur in reality, mean that the new tunnel is excavated when the steady state of the lining structure and ground displacement caused by the existing tunnel excavation have been reached. To highlight the influence of the excavation process of a new tunnel on an existing tunnel, a center-to-center distance (
B) of 11.75 m (
B=1.25
D) in the vertical direction was adopted in this study.
A full model of twin stacked tunnels, consider ing a height of 71.75 m and a width of 160 m, was adopted. The mesh length of the model was 120 m. The excavation step length was 1.5 m, a distance that corresponds to the width of a lining ring. The nodes on all sides of the model were fixed in the horizontal directions in the
x-
z and
y-
z planes (i.e.,
y=0,
y=120,
x=−80, and
x=80), while the nodes at the base of the model (
z=−51.75) were fixed in the vertical (
z) direction. A perspective view of half of the developed numerical model, which is composed of about 920 000 grid points and 800 000 zones, can be seen in Fig.
1. A staggered pattern of the joints in successive lining rings was adopted (Do et al.,
2014b).
Fig.1
Perspective view of half of the developed numerical model introduced into FLAC3D (case 1)
3. Numerical results and discussion
To understand the behaviour of stacked tunnels during the excavation of a new tunnel, this section presents the variations in the structural lining forces that are induced in both tunnels and in the ground displacements during advancement of the new tunnel. The variations in structural forces of both an existing and a new tunnel, and in the ground displacements, have been shown to occur at the section corresponding to the 30th ring, which is hereafter referred to as the measured section or measured ring in both tunnels, counting from the model boundary (
y=0 m). The influence of the boundary condition on tunnel behaviour is negligible at this section (Do et al.,
2014a). The
Y
UL value in Figs.
2,
8,
13,
18 and Table
3 represents the distance from the new (lower) tunnel face to the measured section for case 1. The
Y
LU value in Figs.
4,
9,
14,
19 and Table
4 represents the distance from the new (upper) tunnel face to the measured section for case 2. Negative values of
Y
UL used in case 1 mean that the lower tunnel’s face has still not yet reached the measured section in the upper tunnel, while positive values of
Y
UL mean that the lower tunnel’s face has already passed over the measured section in the upper tunnel. The same convention is adopted for the
Y
LU value. The
R values in Tables
3,
4,
6, and
7 represent the ratios between the results obtained in the case of twin stacked tunnels and the corresponding results obtained in the case of a single tunnel.
Table 3
Development of the structural forces and deformation in the measured ring (ring 30) of the existing (upper) tunnel and surface settlement during advancement of the new (lower) tunnel (case 1)
| Parameter |
Single upper tunnel |
Distance, Y
UL (m)
|
Final lower tunnel, B
|
B/A (%) |
| −1.9D
|
−1D
|
0 |
1.3D
|
2.6D
|
5.3D, A
|
| Max. pos. bending moment (kN·m/m) |
69.2 |
78.3 |
84.3 |
48.9 |
73.7 |
89.1 |
92.9 |
40.5 |
43.6 |
|
R
M+
(%) |
100 |
113.2 |
121.8 |
70.7 |
106.5 |
128.8 |
134.2 |
58.5 |
| Min. neg. bending moment (kN·m/m) |
−95.1 |
−109.8 |
−113.2 |
−48.1 |
−125.5 |
−117.6 |
−113.8 |
−48.1 |
42.3 |
|
R
M−
(%) |
100 |
115.5 |
119.0 |
50.6 |
132.0 |
123.7 |
119.7 |
50.6 |
| Max. normal force (kN/m) |
1466 |
1527 |
1622 |
1597 |
1107 |
1016 |
1017 |
2203 |
216.6 |
|
R
N (%) |
100 |
104.2 |
110.6 |
108.9 |
75.5 |
69.3 |
69.4 |
150.3 |
| Max. longitudinal force (kN/m) |
1669 |
1965 |
2212 |
1565 |
1896 |
1604 |
1690 |
1033 |
61.1 |
|
R
LN (%) |
100 |
117.7 |
132.5 |
93.8 |
113.6 |
96.1 |
101.3 |
61.9 |
| Max. normal displacement (mm) |
5.24 |
6.37 |
7.88 |
10.27 |
13.17 |
15.79 |
16.72 |
1.36 |
8.1 |
|
R
disp+
(%) |
100 |
121.6 |
150.4 |
196.0 |
251.3 |
301.3 |
319.1 |
26.0 |
| Min. normal displacement (mm) |
−2.59 |
−3.17 |
−3.85 |
−7.82 |
−14.54 |
−15.27 |
−15.76 |
−0.69 |
4.4 |
|
R
disp−
(%) |
100 |
122.4 |
148.6 |
301.9 |
561.4 |
589.6 |
608.5 |
26.6 |
| Max. settlement (%D) |
−0.26 |
−0.27 |
−0.28 |
−0.30 |
−0.33 |
−0.36 |
−0.36 |
– |
|
R
set (%) |
100 |
105.0 |
109.5 |
118.2 |
128.9 |
139.3 |
140.1 |
– |
Table 4
Development of the structural forces and deformation in the measured ring (ring 30) of the existing (lower) tunnel and surface settlement during advancement of the new (upper) tunnel (case 2)
| Parameter |
Single lower tunnel |
Distance, Y
LU (m)
|
Final upper tunnel, A
|
B/A (%) |
| −1.9D
|
−1D
|
0 |
1.3D
|
2.6D
|
5.3D, B
|
| Max. pos. bending moment (kN·m/m) |
60.5 |
64.6 |
62.9 |
48.1 |
36.5 |
44.4 |
53.4 |
80.6 |
66.3 |
|
R
M+
(%) |
100 |
106.8 |
104.0 |
79.5 |
60.3 |
73.4 |
88.3 |
133.2 |
| Min. neg. bending moment (kN·m/m) |
−85.4 |
−91.4 |
−92.4 |
−67.1 |
−42.1 |
−61.5 |
−74.6 |
−85.3 |
87.5 |
|
R
M− (%) |
100 |
107.0 |
108.2 |
78.6 |
49.3 |
72.0 |
87.4 |
99.9 |
| Max. normal force (kN/m) |
2335 |
2365 |
2374 |
2268 |
2265 |
2216 |
2247 |
1471 |
152.8 |
|
R
N (%) |
100 |
101.3 |
101.7 |
97.1 |
97.0 |
94.9 |
96.2 |
63.0 |
| Max. longitudinal force (kN/m) |
1283 |
1353 |
1411 |
1286 |
1350 |
1270 |
1322 |
1517 |
87.1 |
|
R
LN (%) |
100 |
105.5 |
110.0 |
100.2 |
105.2 |
99.0 |
103.0 |
118.2 |
| Max. normal displacement (mm) |
3.95 |
3.84 |
3.54 |
1.78 |
2.42 |
2.89 |
2.40 |
5.82 |
41.2 |
|
R
disp+
(%) |
100 |
97.2 |
89.6 |
45.1 |
61.3 |
73.2 |
60.8 |
147.3 |
| Min. normal displacement (mm) |
−1.87 |
−1.98 |
−1.96 |
−1.27 |
−0.88 |
−1.33 |
−1.55 |
−2.55 |
60.8 |
|
R
disp−
(%) |
100 |
105.9 |
104.8 |
67.9 |
47.1 |
71.1 |
82.9 |
136.4 |
| Max. settlement (%D) |
−0.17 |
−0.17 |
−0.17 |
−0.20 |
−0.26 |
−0.30 |
−0.32 |
– |
|
R
set (%) |
100 |
99.4 |
101.9 |
116.4 |
155.3 |
179.2 |
189.9 |
– |
3.1. Surface settlements
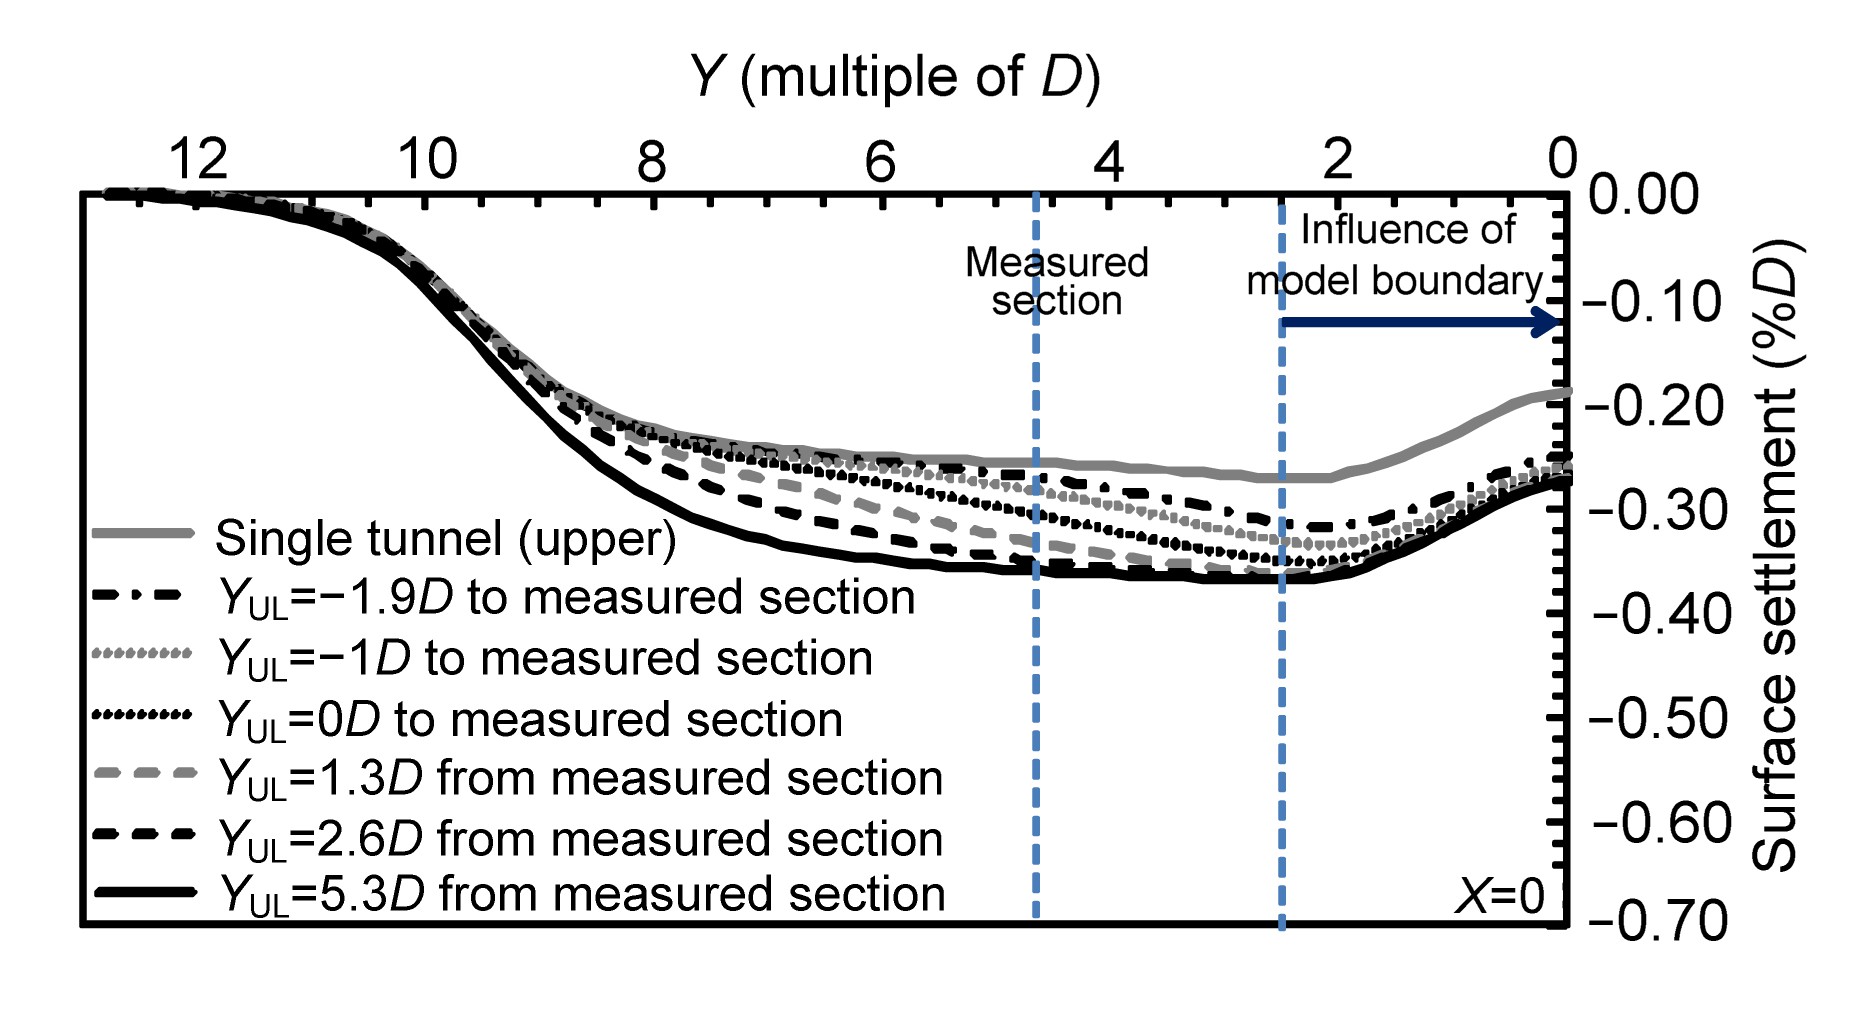
The development of the surface settlement trough in the longitudinal section, during the new (lower) tunnel face advancement, is shown in Fig.
2 for case 1. Fig.
2 indicates that the stacked tunnels cause an increase in the surface settlement. This could be explained by the accumulation of the ground lost from both tunnels. The maximum settlement measured above the stacked tunnels was 40.1% higher than that developed above a single upper tunnel (Table
3). Fig.
2 also indicates that the surface settlement at the measured section begins to be affected by the new (lower) excavation when the face of this tunnel approaches a distance of about 1.9
D. The change in surface settlement for a larger value of
Y
UL distance is less than 5%, and can therefore be neglected.
Fig.2
Longitudinal settlements on the ground surface above the stacked tunnels, case 1
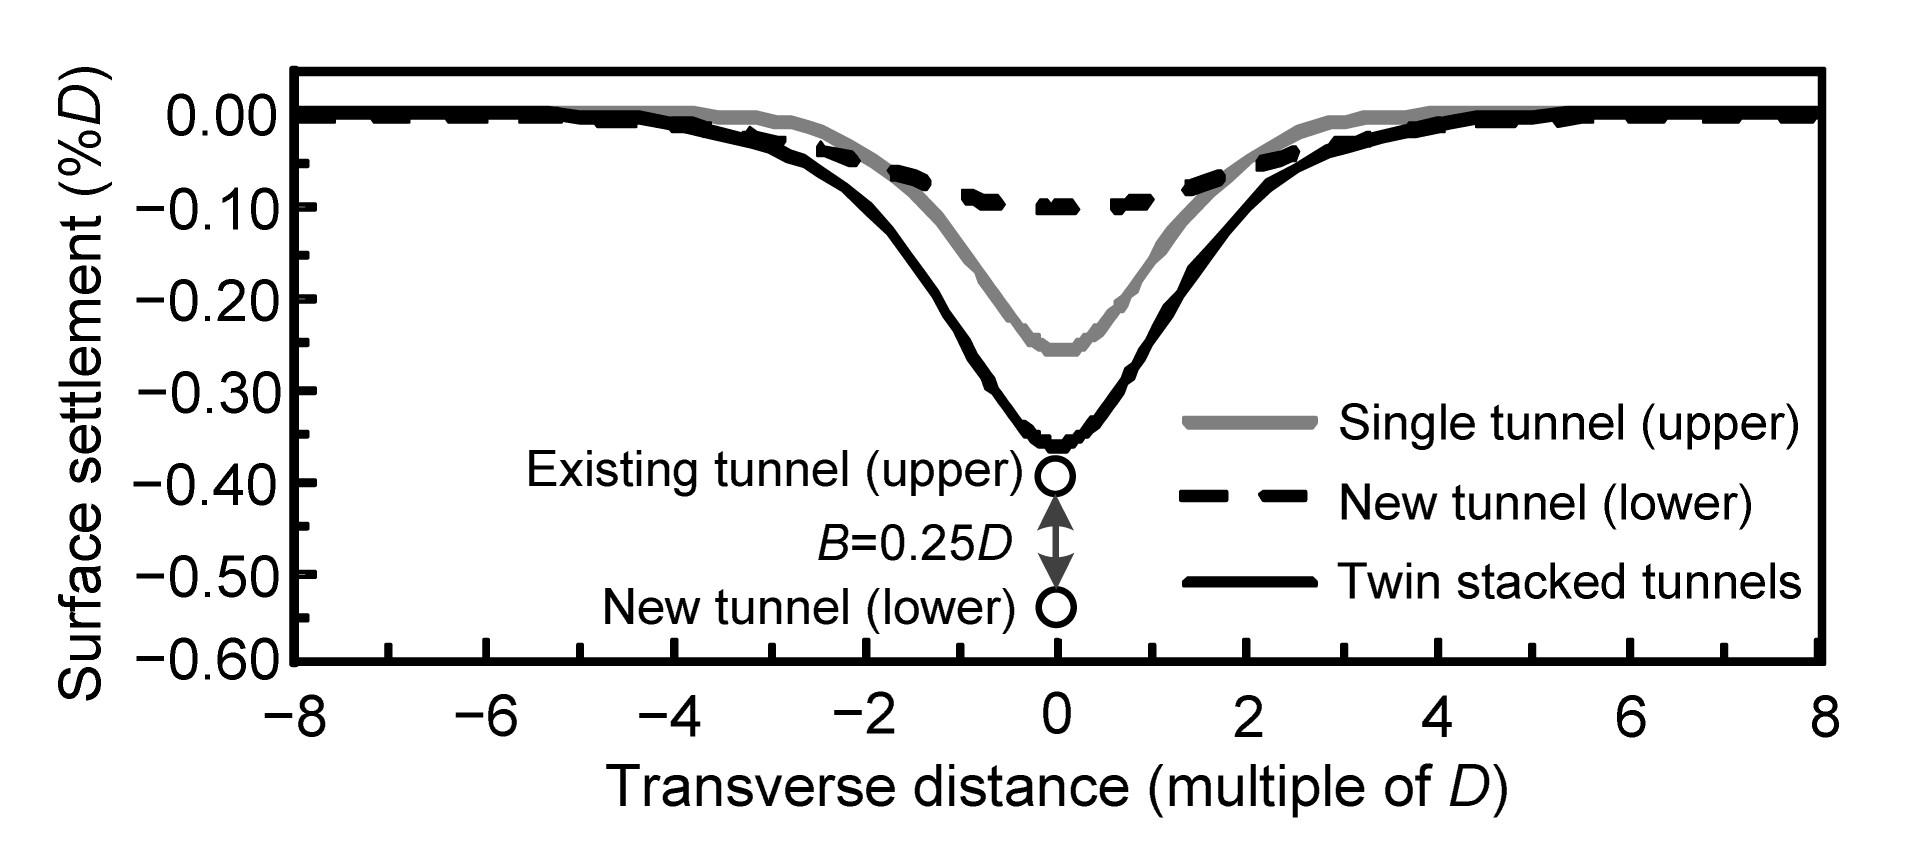
Fig.
3 shows that the two settlement troughs caused by the construction of the two tunnels are different. The settlement trough above the new tunnel is determined on the basis of the final settlement trough of the twin tunnels minus the settlement trough developed above the existing tunnel before it interacts with the new tunnel. The settlement trough caused by the new (lower) tunnel excavation is shallower and wider than that caused by the existing (upper) tunnel. The volume loss ratios, determined at the final state as the ratio of the settlement trough area developed on the ground surface to the cross-sectional area of the tunnel, of the existing (upper) and new (lower) tunnels are equal to about 0.88% and 0.62%, respectively, and the total volume loss above the stacked tunnels in case 1 is, therefore, 1.50%.
Fig.3
Comparison of the settlement troughs in the transverse section of the stacked tunnels, case 1
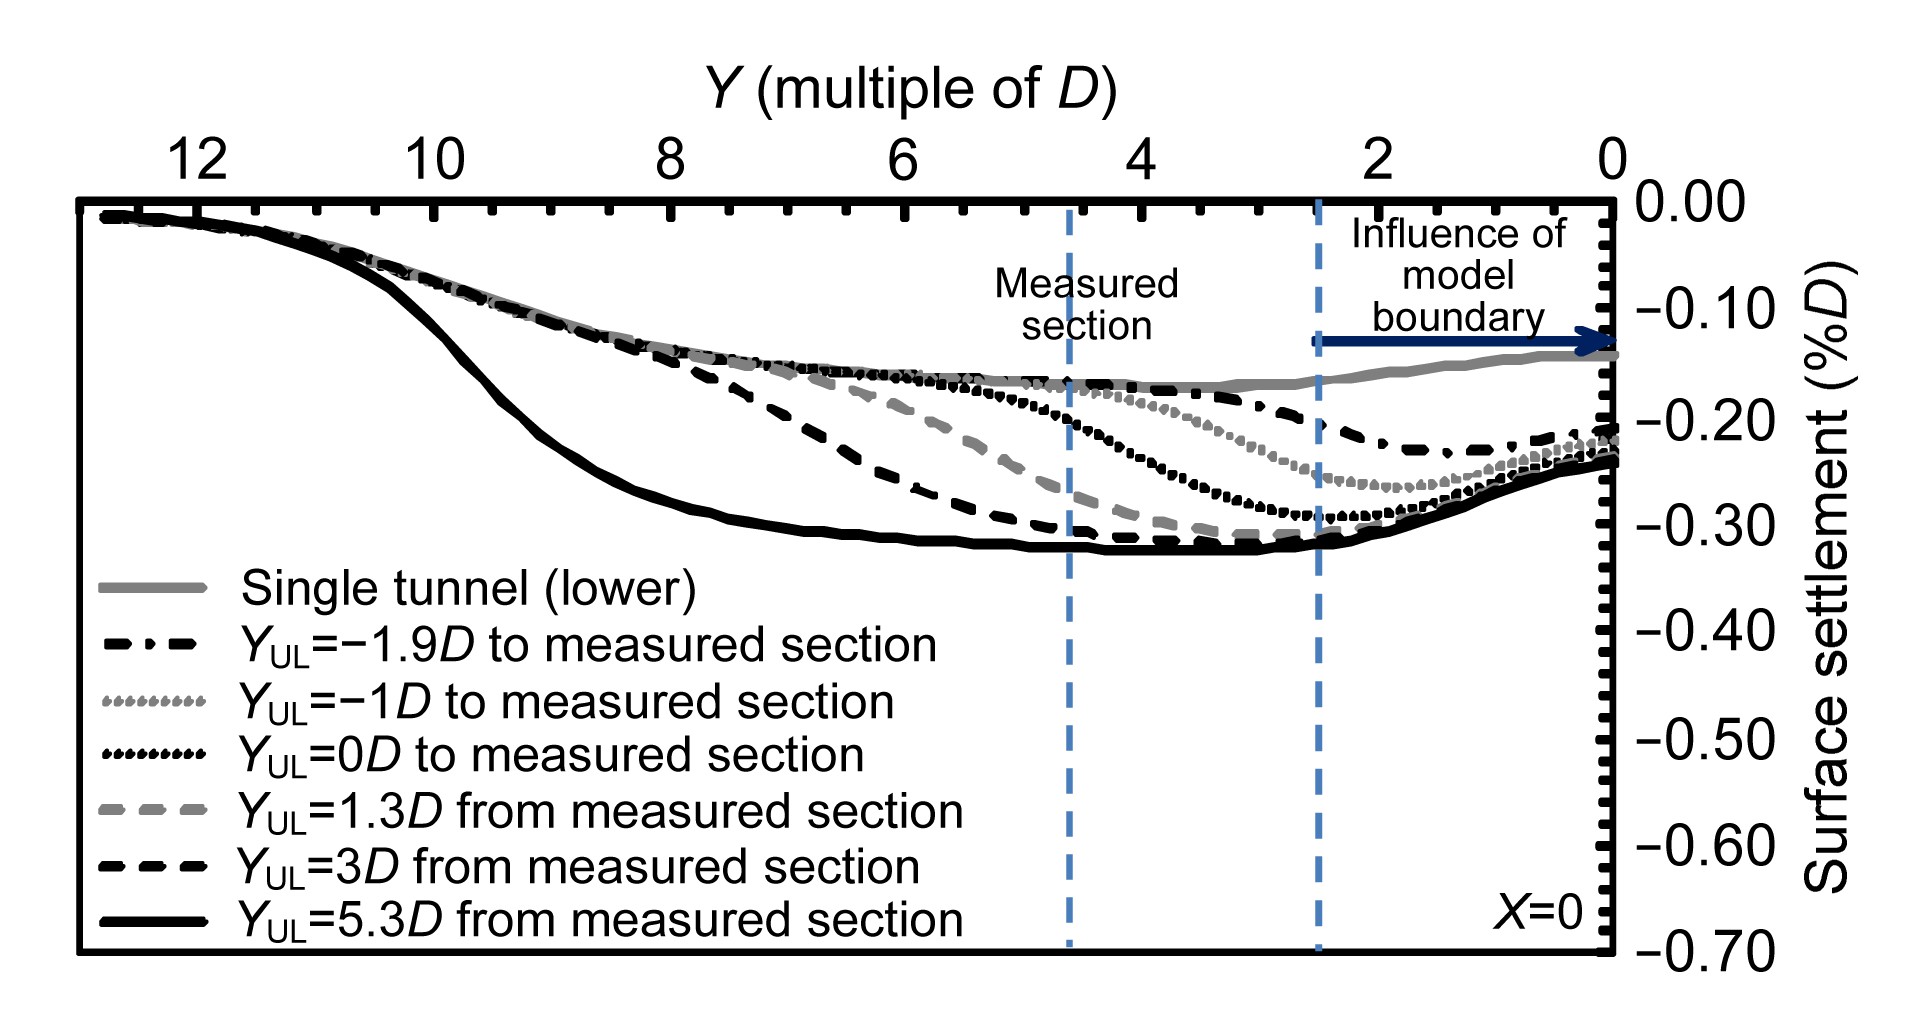
In case 2, when the lower tunnel is excavated first, the slopes of the longitudinal surface troughs are steeper than those observed in case 1 during the advancement of the new (upper) tunnel (Figs.
2 and
4). This could be explained by the shallower depth of the new tunnel in case 2. The surface settlement at the measured section begins to be affected by the new (upper) excavation when the face of this tunnel approaches a distance of about 1
D (Fig.
4). This distance is shorter than that determined in case 1. The settlement trough caused by the new (upper) tunnel excavation is smaller and narrower than that caused by the existing (lower) tunnel. The volume loss ratios, determined at the final state, of the existing (lower) tunnel and new (upper) tunnel are similar and equal to about 0.93% and 0.45%, respectively, and the total volume loss above the twin tunnels is, therefore, 1.38% (Fig.
5). Comparing these results with those obtained for case 1, the surface settlements above the stacked tunnels in case 1, in which the upper tunnel is excavated first, are more important than the surface settlements obtained in case 2 (Fig.
6). This could be attributed to the fact that the additional settlement caused by the excavation of the following (new) tunnel through the soil mass, which has been disturbed by the excavation of the preceding (existing) tunnel, is usually smaller than that induced when this tunnel is excavated first through an undisturbed zone.
Fig.4
Longitudinal settlements on the ground surface above the stacked tunnels, case 2
Fig.5
Comparison of the settlement trough in the transverse section of the stacked tunnels, case 2
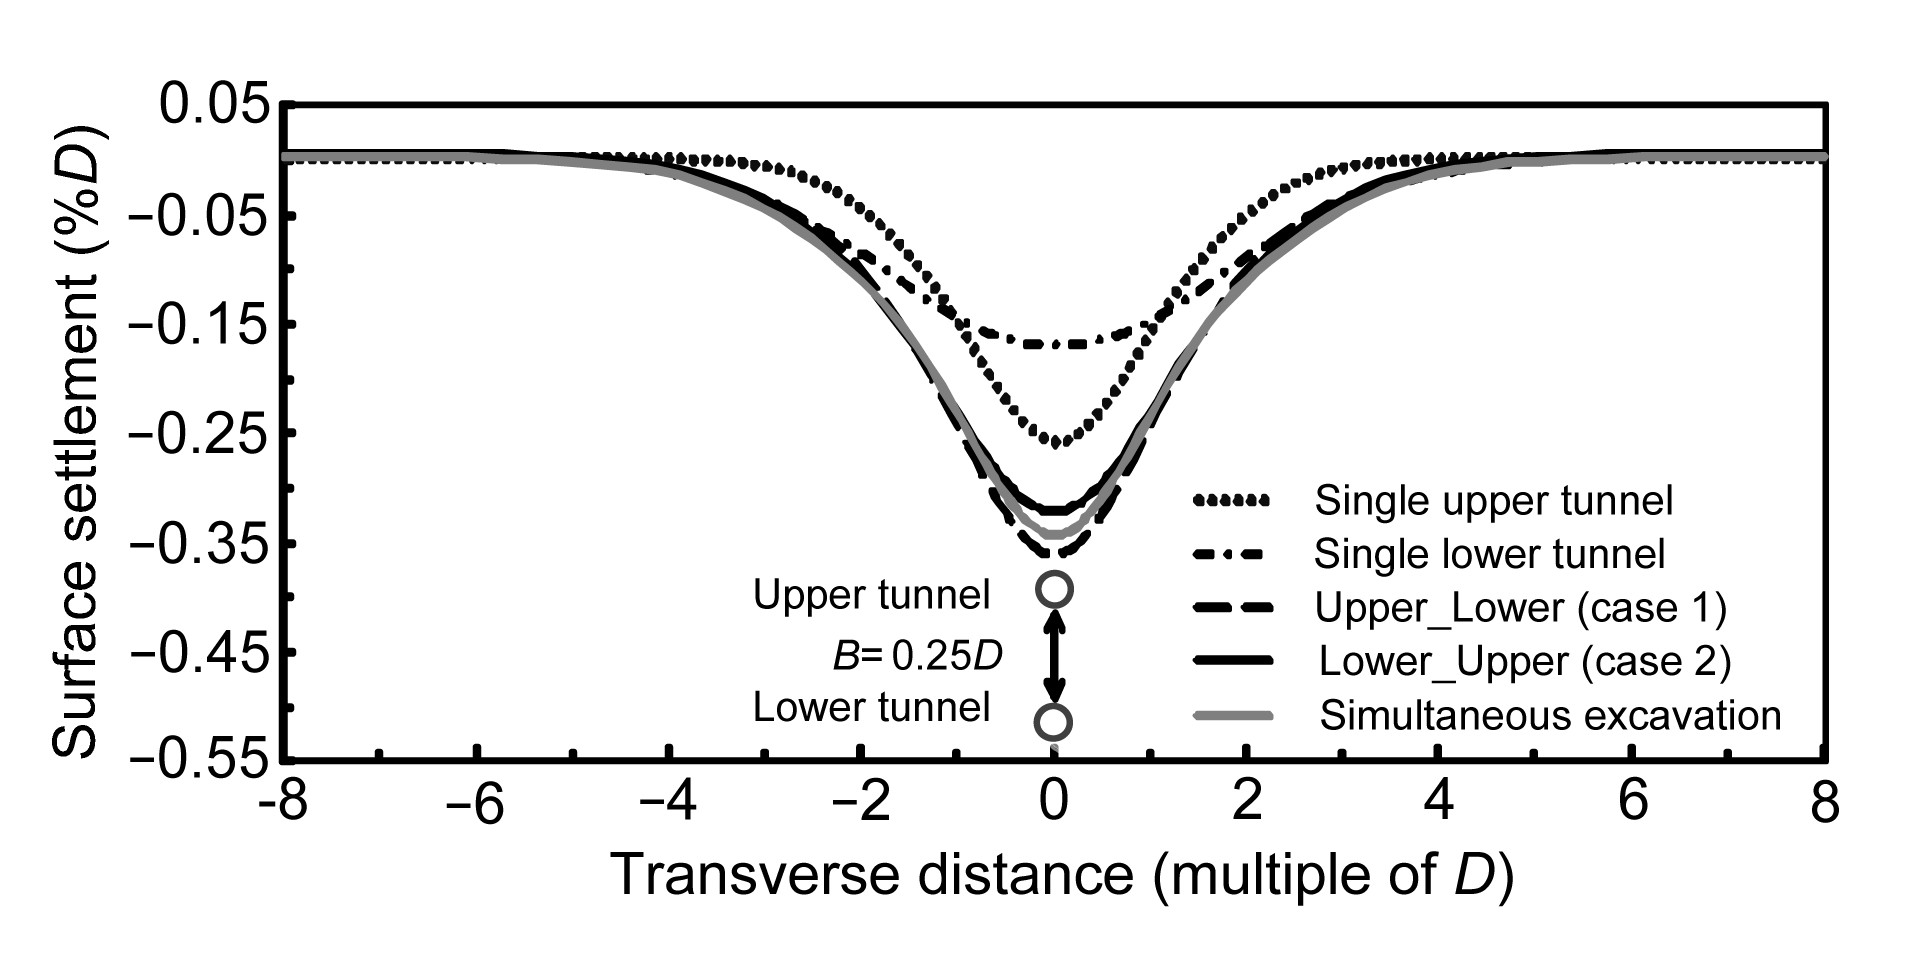
Fig.6
Comparison of the settlement trough in the transverse section of the stacked tunnels for different construction procedures
This is why the volume of the settlement trough caused by the excavation of the upper tunnel in case 2, in which the lower tunnel is excavated first, is smaller than that caused by this tunnel in case 1. The same phenomenon is observed for the lower tunnel. In addition, the proportion of the surface settlement caused by the shallower tunnel is always greater than that caused by the deeper tunnel excavated in the same medium. Consequently, the total settlement above the twin tunnels in case 2 is smaller than that obtained in case 1 (Fig.
6). This result is in good agreement with the 2D numerical results obtained by Hage Chehade and Shahrour (
2008) and Channabasavaraj and Vishwanath (
2012).
The settlement value of 32.2 mm determined in case 3, in which two stacked tunnels are excavated simultaneously, falls in between those obtained in the two previous cases (Fig.
6). However, the widths of the settlement troughs are similar in all three cases. In addition, as for a single tunnel, the smaller the tunnel depth is, the greater and narrower the surface settlement trough is. This result is in good agreement with the 2D numerical results obtained by Hejazi et al. (
2008). As expected, the settlement profiles in the transverse section in all three cases are always symmetric over the tunnel center.
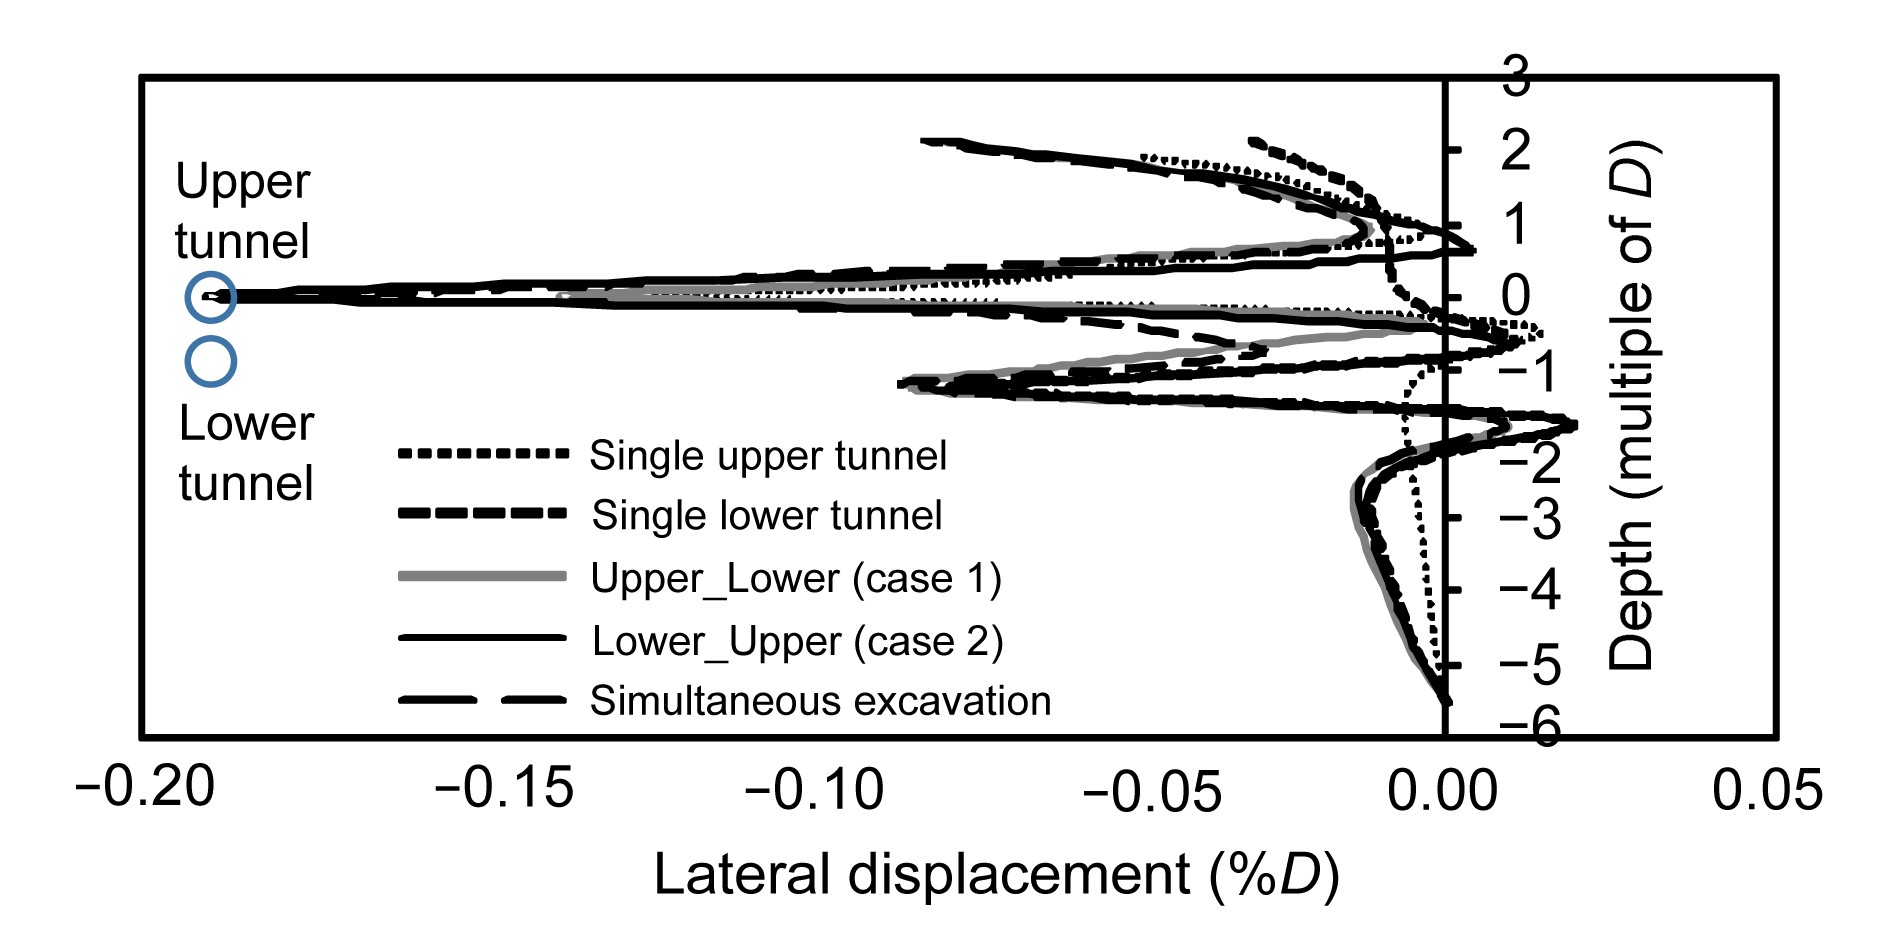
3.2. Horizontal ground displacement
The lateral displacements of the ground during the excavation of a single tunnel or stacked tunnels along the TS axis, which is on the right side of two tunnels at a section of the measured lining ring (ring 30) and at a distance of 1.25
D from the tunnel centers, are shown in Fig.
7. In the case of a single tunnel, an increase in tunnel depth is followed by a reduction in lateral displacement. This could be attributed to a greater lateral confinement stress, caused by the increase in tunnel depth. In the case of stacked tunnels, the lateral displacements are greatly affected by the tunnelling procedure. In case 1, when the upper tunnel is excavated first, the maximum final lateral displacement of about 12.8 mm (0.136%
D) is smaller than the corresponding displacement of about 17.9 mm (0.19%
D) obtained in case 2, in which the lower tunnel is excavated first, and of about 16.2 mm (0.172%
D) in case 3, in which two tunnels are excavated simultaneously.
Fig.7
Horizontal displacements along the TS axis at a section of the measured lining ring (ring 30)
3.3. Normal displacement in the tunnel lining
In this section, the positive and negative normal displacements correspond to the outward and inward deformations of the tunnel lining.
As expected, the existing tunnel linings in both cases 1 and 2 are deformed during the advancement of the new tunnel. In case 1, in which the upper tunnel is excavated first, gradual increases in inward deformations at the crown and outward deformation at the bottom of the upper tunnel are observed during the advancement of the new (lower) tunnel (Fig.
8), due to the downward movement of the soil zone above the lower tunnel.
Fig.8
Normal displacement in measured lining ring 30 of the existing (upper) tunnel lining, case 1
The displacements reach maximum values of about 319.1% and 608.5%, respectively, of those of single tunnel at the final state (Table
3). This indicates that the deformation of the existing tunnel is a vertical expansion. This result is in good agreement with the measured results obtained by Yamaguchi et al. (
1998). The inward deformations on the two tunnel sides of the upper tunnel seem to be caused mainly by the vertical expansion of the lining.
On the other hand, the deformations of the lower tunnel lining are very small in case 1 (Fig.
8). The maximum and minimum deformations in the lower tunnel, at the steady state, are about 8.1% and 4.4%, respectively, of those in the upper tunnel (Table
3). This could be explained by the fact that the external forces that act on the lower tunnel lining seem to be more uniform than those applied in the upper tunnel.
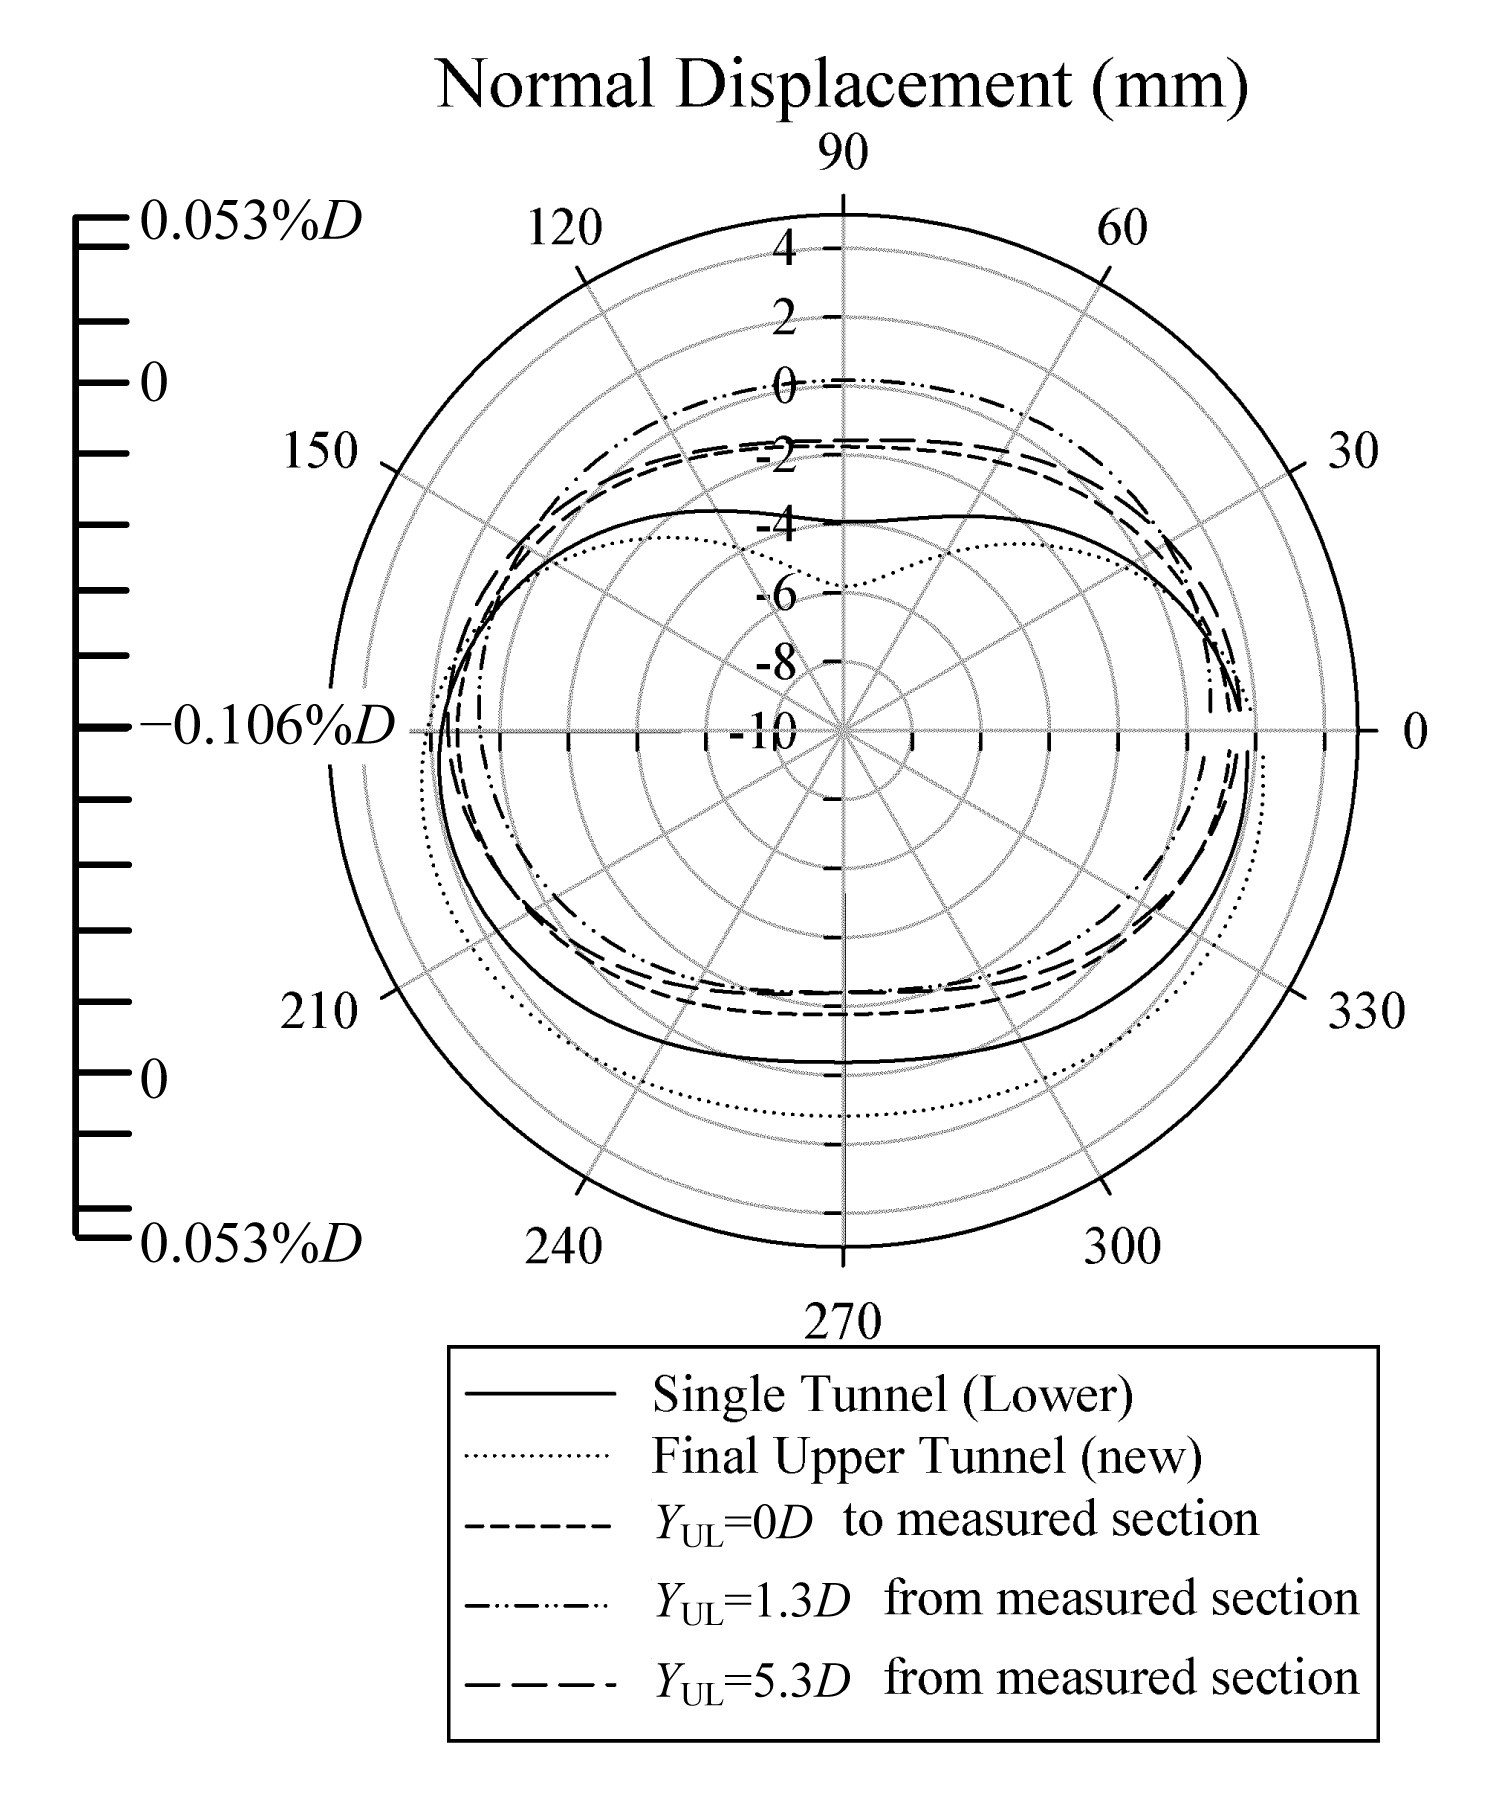
As in case 1, in case 2, in which the lower tunnel is excavated first, the changes in normal deformation of the existing (lower) tunnel lining occur mainly at the tunnel crown (Fig.
9) during the advance of the new (upper) tunnel. The decrease in the inward deformation that occurred at the crown of the lower tunnel in this case could be attributed to the uplift movement at the bottom of the new (upper) tunnel during the excavation, due to the low value of the lateral earth pressure coefficient (
K
0=0.5) adopted in this study. The maximum and minimum deformations in the lower tunnel lining, at the final state, are about 60.8% and 82.9%, respectively, of those of a single tunnel. They are also 41.2% and 60.8% smaller than those induced in the new (upper) tunnel (Table
4).
Fig.9
Normal displacement in measured lining ring 30 of the existing (lower) tunnel lining, case 2
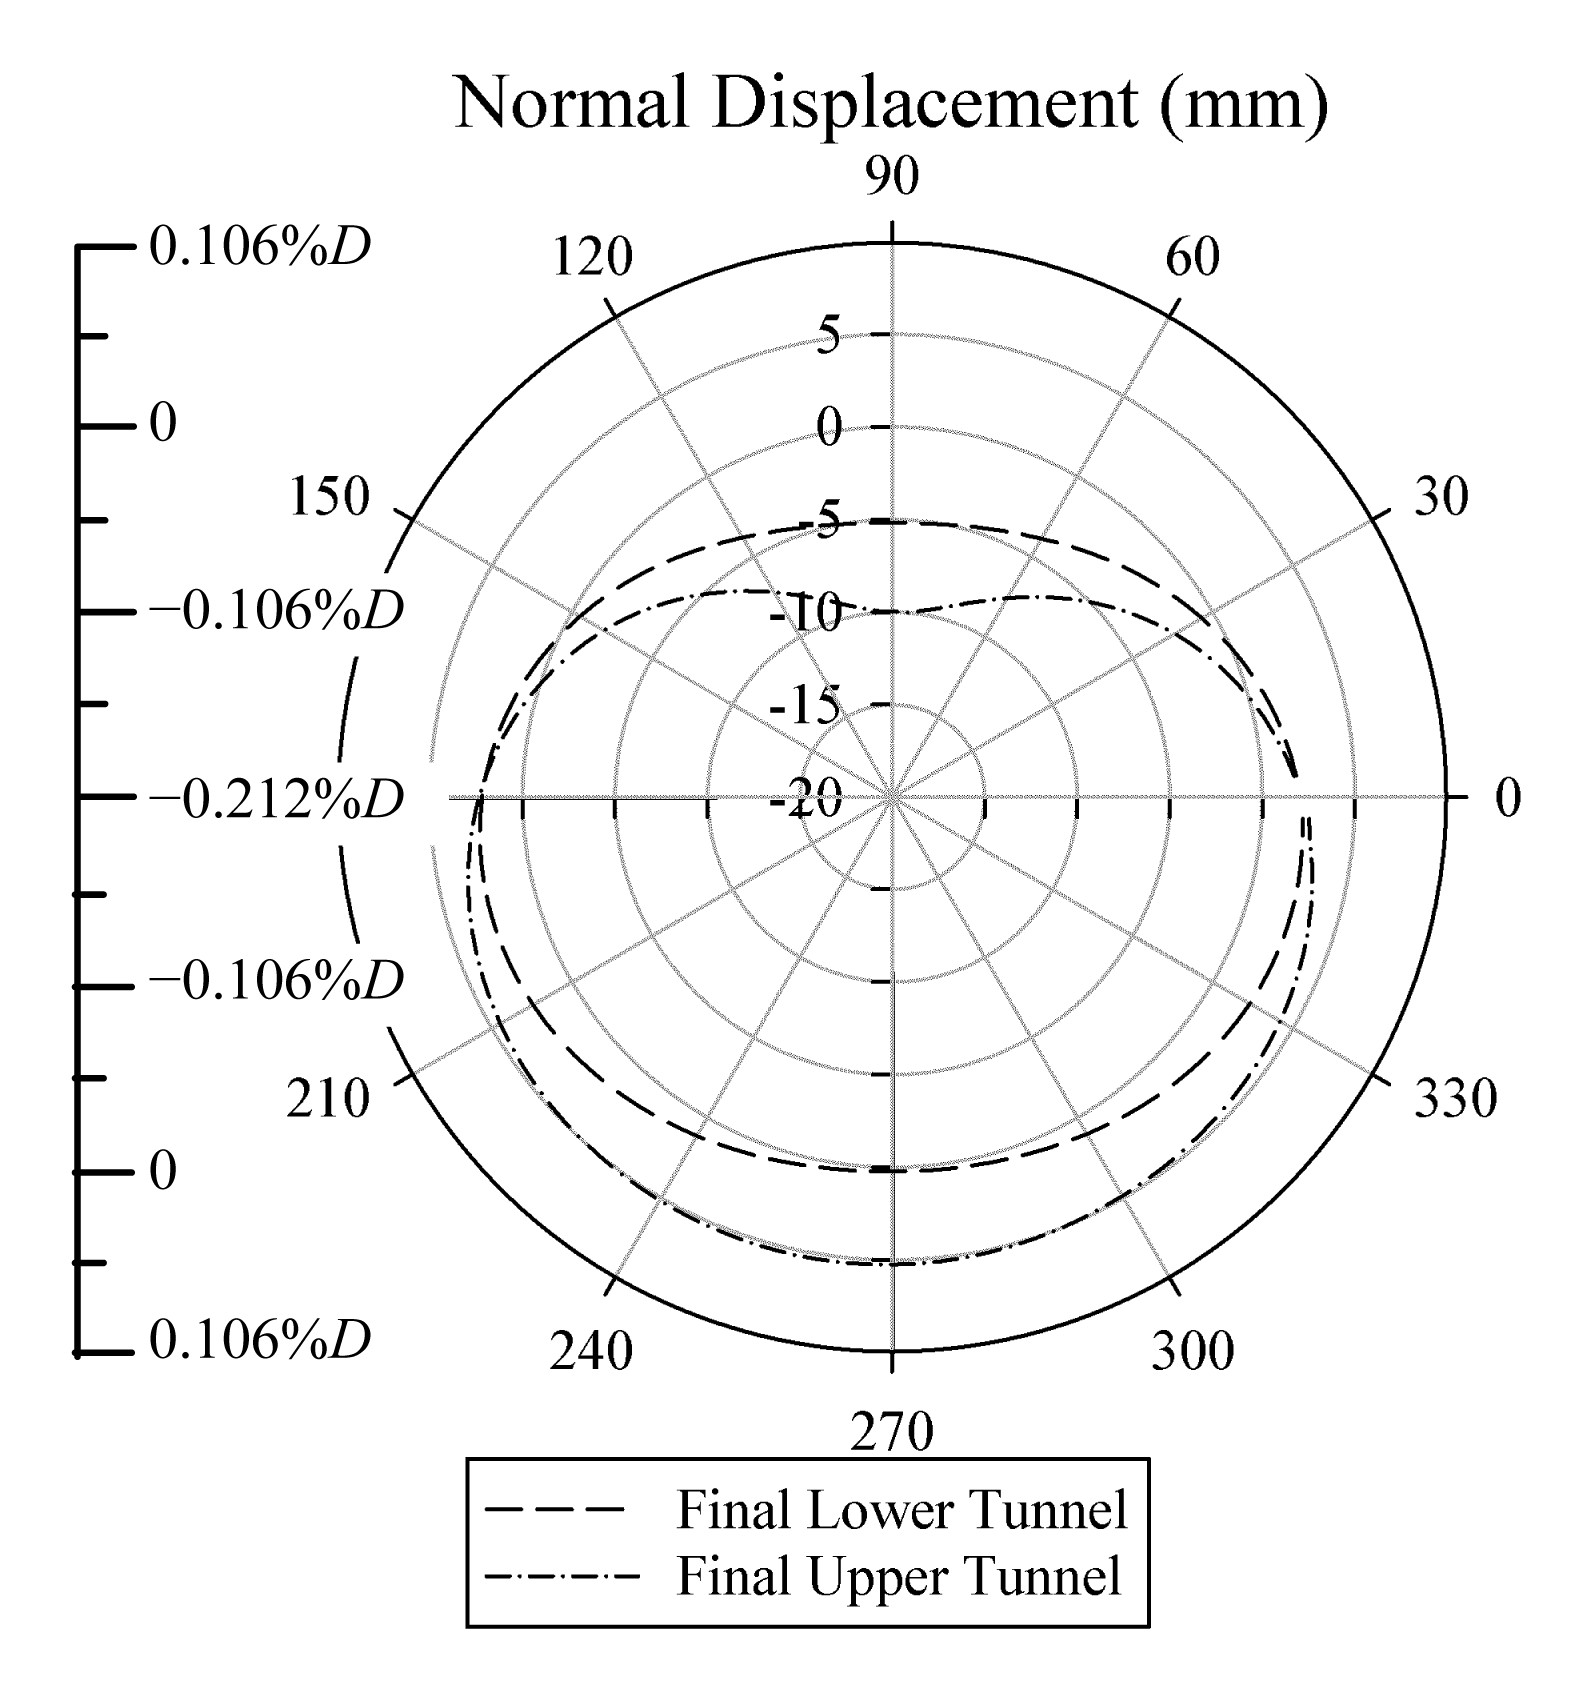
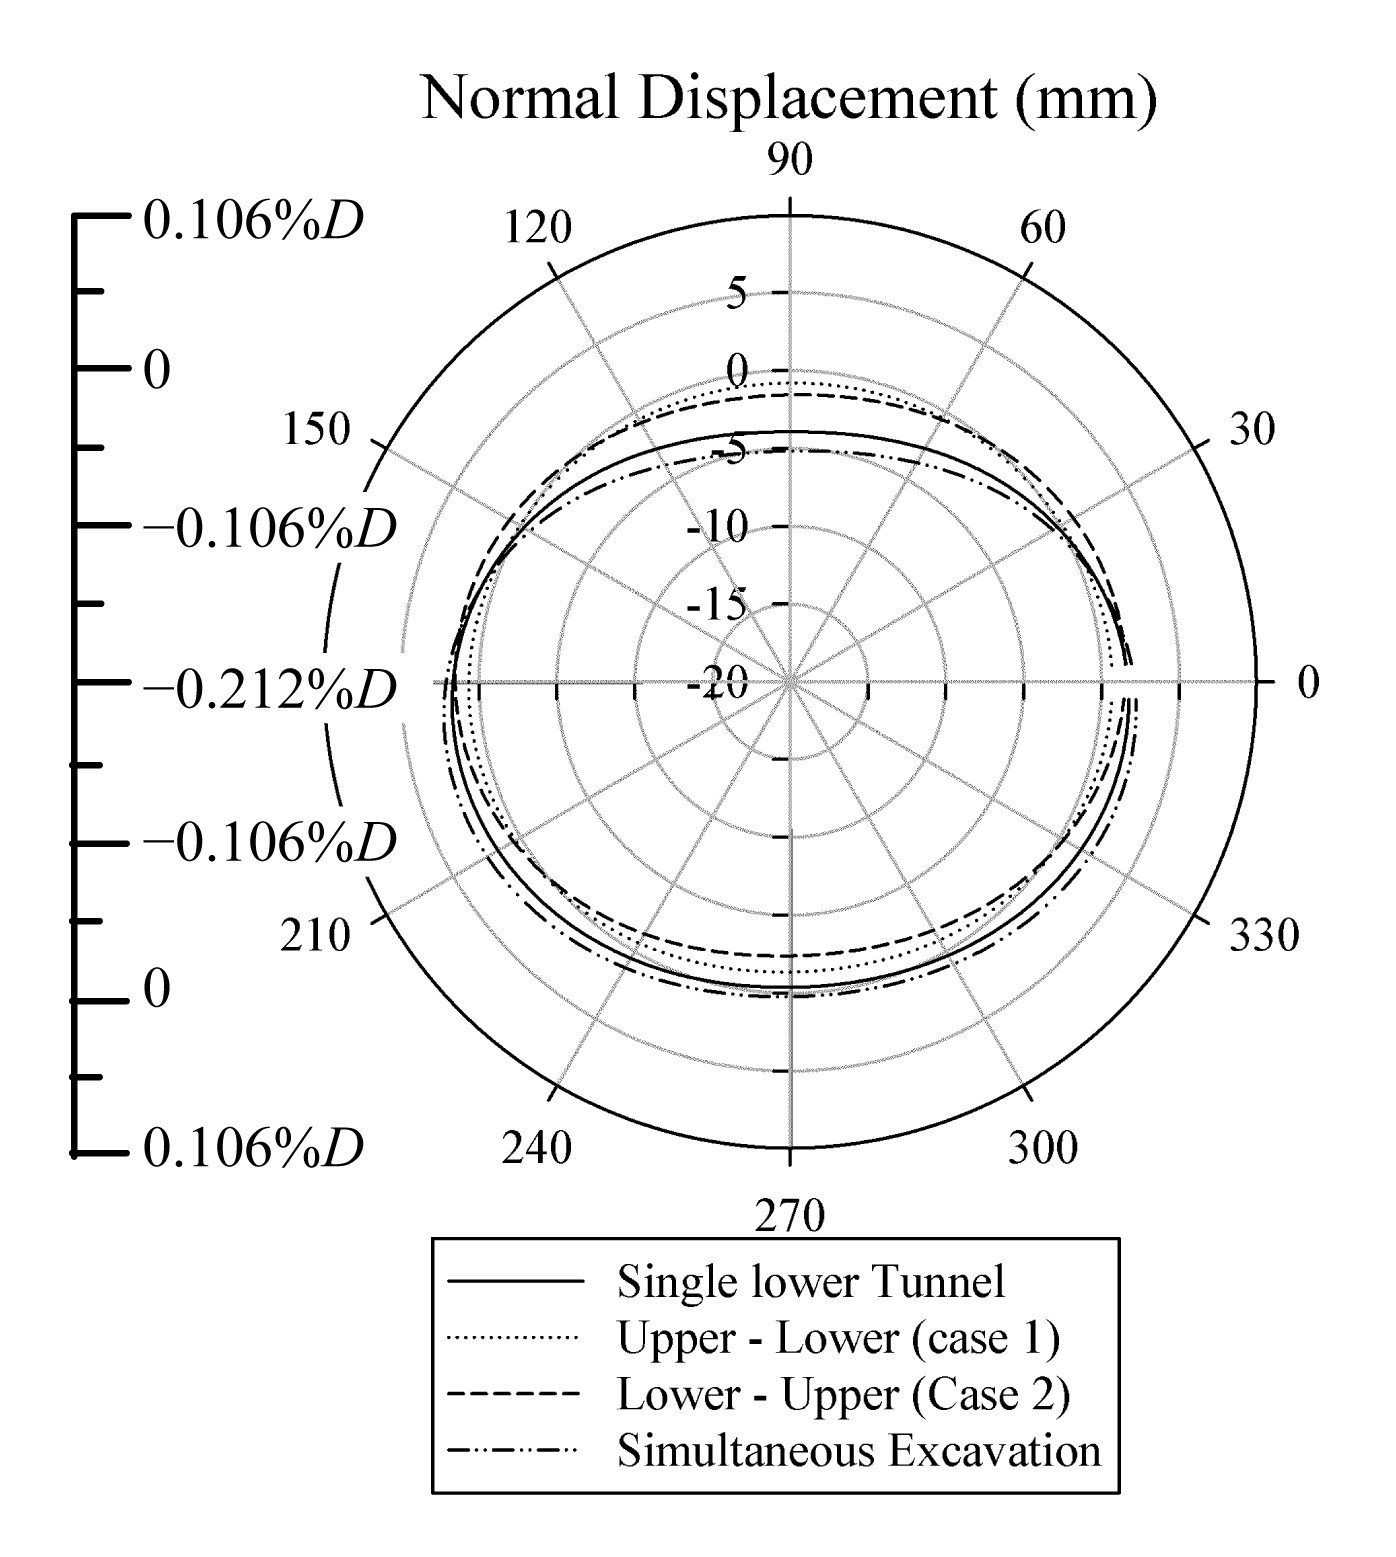
In the case of stacked tunnels that are excavated simultaneously (case 3), the numerical results present a gradual increase in the normal displacements in both tunnels during the tunnel face advancement. At the steady state, both the maximum and minimum normal displacements developed in the upper tunnel are larger than those in the lower tunnel (Fig.
10 and Table
5).
Fig.10
Normal displacement in measured lining ring 30 of the stacked tunnel linings, case 3
Table 5
Comparison of the structural forces and deformation in the measured ring (ring 30) of the stacked tunnels at the final state in the case of simultaneous excavation (case 3)
| Parameter |
Upper tunnel, A
|
Lower tunnel, B
|
B/A (%) |
| Max. pos. bending moment (kN·m/m) |
103.0 |
72.6 |
70.5 |
| Min. neg. bending moment (kN·m/m) |
−93.5 |
−102.9 |
110.1 |
| Max. normal force (kN/m) |
1483 |
2144 |
144.6 |
| Max. longitudinal force (kN/m) |
1759 |
1608 |
91.4 |
| Max. normal displacement (mm) |
10.04 |
5.19 |
51.7 |
| Min. normal displacement (mm) |
−5.28 |
−2.57 |
48.7 |
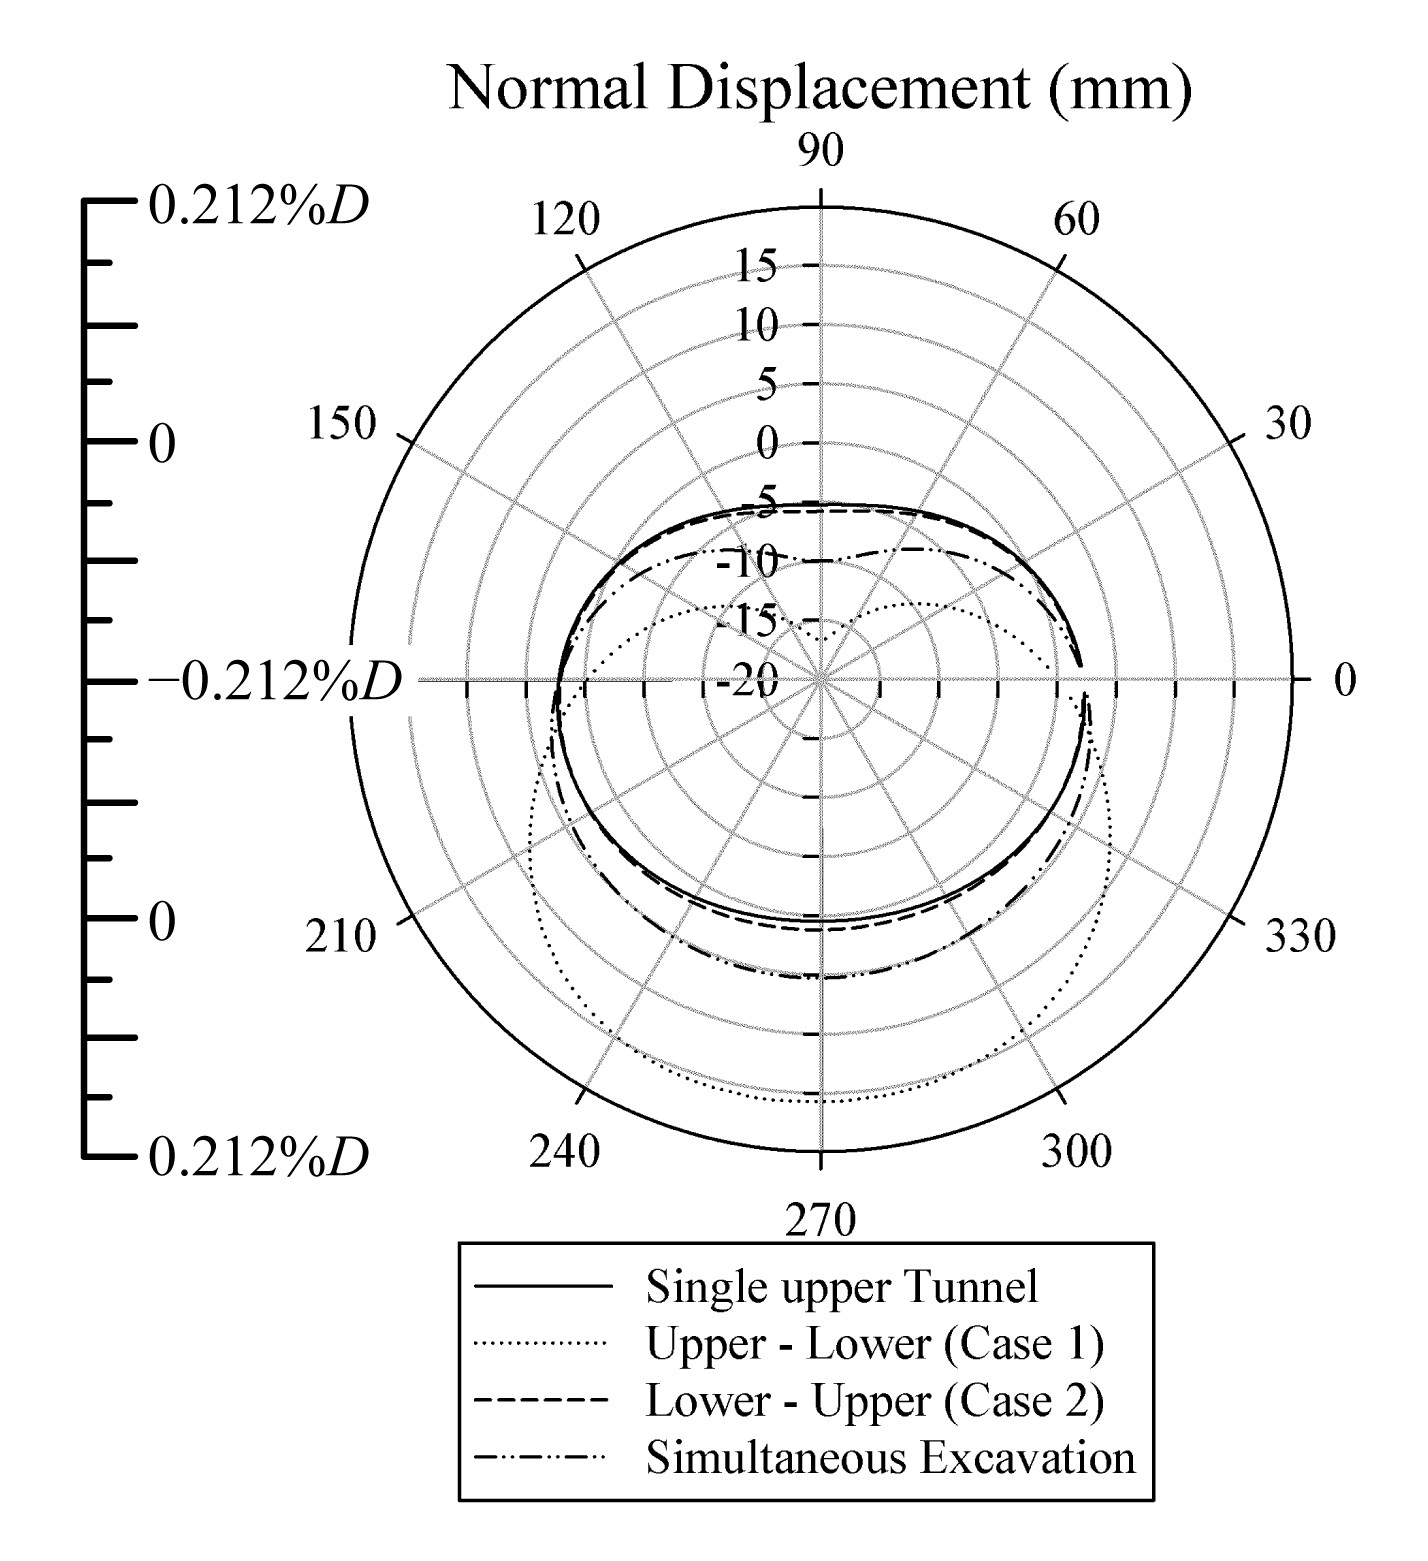
To highlight the effect of the tunnelling procedure, Figs.
11 and
12 show a comparison of the normal deformations in the two stacked tunnel linings. It is reasonable to conclude that the upper tunnel is affected more by the tunnelling procedure than the lower tunnel. Fig.
11 and Table
6 show smaller deformations of about 34.8% (maximum) and 16.2% (minimum) in the upper tunnel lining obtained in case 2 compared to those induced in case 1. Generally, in all three cases of stacked tunnels, the normal deformations in the upper tunnel are always greater than those that develop in a single tunnel (Table
6).
Fig.11
Comparison of the normal displacement in measured lining ring 30 of the upper tunnel lining
Table 6
Comparisons of the structural forces and deformation in the measured ring (ring 30) of the upper tunnel for the three construction procedure cases
| Parameter |
Single upper tunnel |
Case 1, A
|
Case 2, B
|
Case 3 |
B/A (%) |
| Max. pos. bending moment (kN·m/m) |
69.2 |
92.9 |
80.6 |
103.0 |
86.8 |
|
R
M+ (%) |
100 |
134.2 |
116.5 |
148.8 |
| Min. neg. bending moment (kN·m/m) |
−95.1 |
−113.8 |
−85.3 |
−93.5 |
75.0 |
|
R
M− (%) |
100 |
119.7 |
89.7 |
98.3 |
| Max. normal force (kN/m) |
1466 |
1017 |
1471 |
1483 |
144.6 |
|
R
N (%) |
100 |
69.4 |
100.3 |
101.2 |
| Max. longitudinal force (kN/m) |
1669 |
1690 |
1571 |
1759 |
93.0 |
|
R
LN (%) |
100 |
101.3 |
94.1 |
105.4 |
| Max. normal displacement (mm) |
5.24 |
16.72 |
5.82 |
10.04 |
34.8 |
|
R
disp+ (%) |
100 |
319.1 |
111.1 |
191.6 |
| Min. normal displacement (mm) |
−2.59 |
−15.76 |
−2.55 |
−5.28 |
16.2 |
|
R
disp− (%) |
100 |
608.5 |
98.5 |
203.9 |
| Max. settlement (%D) |
−0.26 |
−0.36 |
−0.32 |
−0.34 |
88.9 |
|
R
set (%) |
100 |
140.1 |
124.8 |
133.1 |
Unlike in the upper tunnel, the normal deformations induced in the lower tunnel in the other cases of stacked tunnels (i.e., cases 1 and 2) are smaller than those developed in a single tunnel, except for case 3, especially at the tunnel crown. The lining deformations in case 2, in which the lower tunnel is excavated first, are higher than those obtained in case 1 (Fig.
12 and Table
7). The decrease in normal deformations at the crown of the lower tunnel could be caused by the upward vertical movement of the soil at the bottom of the upper tunnel, due to the low value of the earth lateral pressure coefficient (
K
0=0.5). Combining this information with the above observation of the upper tunnel, it is reasonable to conclude that the normal deformations of the tunnel lining excavated in the undisturbed soil medium are usually greater than those developed in the lining of the tunnel excavated in soil medium disturbed by the excavation of a preceding tunnel. Similar to the way in which excavation of the tunnel causes a stress relaxation zone (Section 3.4), this phenomenon could be explained by considering the redistribution of the stresses surrounding the excavated tunnel, which leads to a more uniform stress field in the zone through which the subsequent tunnel will be excavated. Consequently, the ovalling deformations and, therefore, whole deformations of the tunnel lining decrease.
Fig.12
Comparison of the normal displacement in measured lining ring 30 of the lower tunnel lining
Table 7
Comparisons of the structural forces and deformation in the measured ring (ring 30) of the lower tunnel for the three construction procedure cases
| Parameter |
Single lower tunnel |
Case 1, A
|
Case 2, B
|
Case 3 |
B/A (%) |
| Max. pos. bending moment (kN·m/m) |
60.5 |
40.5 |
53.4 |
72.6 |
131.9 |
|
R
M+
(%) |
100.0 |
66.9 |
88.3 |
120.0 |
| Min. neg. bending moment (kN·m/m) |
−85.4 |
−48.1 |
−74.6 |
−102.9 |
155.1 |
|
R
M− (%) |
100.0 |
56.3 |
87.4 |
120.5 |
| Max. normal force (kN/m) |
2335 |
2203 |
2247 |
2144 |
102.0 |
|
R
N (%) |
100.0 |
94.3 |
96.2 |
91.8 |
| Max. longitudinal force (kN/m) |
1283 |
1033 |
1322 |
1608 |
128.0 |
|
R
LN (%) |
100.0 |
80.5 |
103.0 |
125.3 |
| Max. normal displacement (mm) |
3.95 |
1.36 |
2.40 |
5.19 |
176.5 |
|
R
disp+ (%) |
100.0 |
34.4 |
60.8 |
131.4 |
| Min. normal displacement (mm) |
−1.87 |
−0.69 |
−1.55 |
−2.57 |
224.6 |
|
R
disp− (%) |
100.0 |
36.9 |
82.9 |
137.4 |
| Max. settlement (%D) |
−0.17 |
−0.36 |
−0.32 |
−0.34 |
88.9 |
|
R
set (%) |
100.0 |
211.8 |
188.2 |
200.0 |
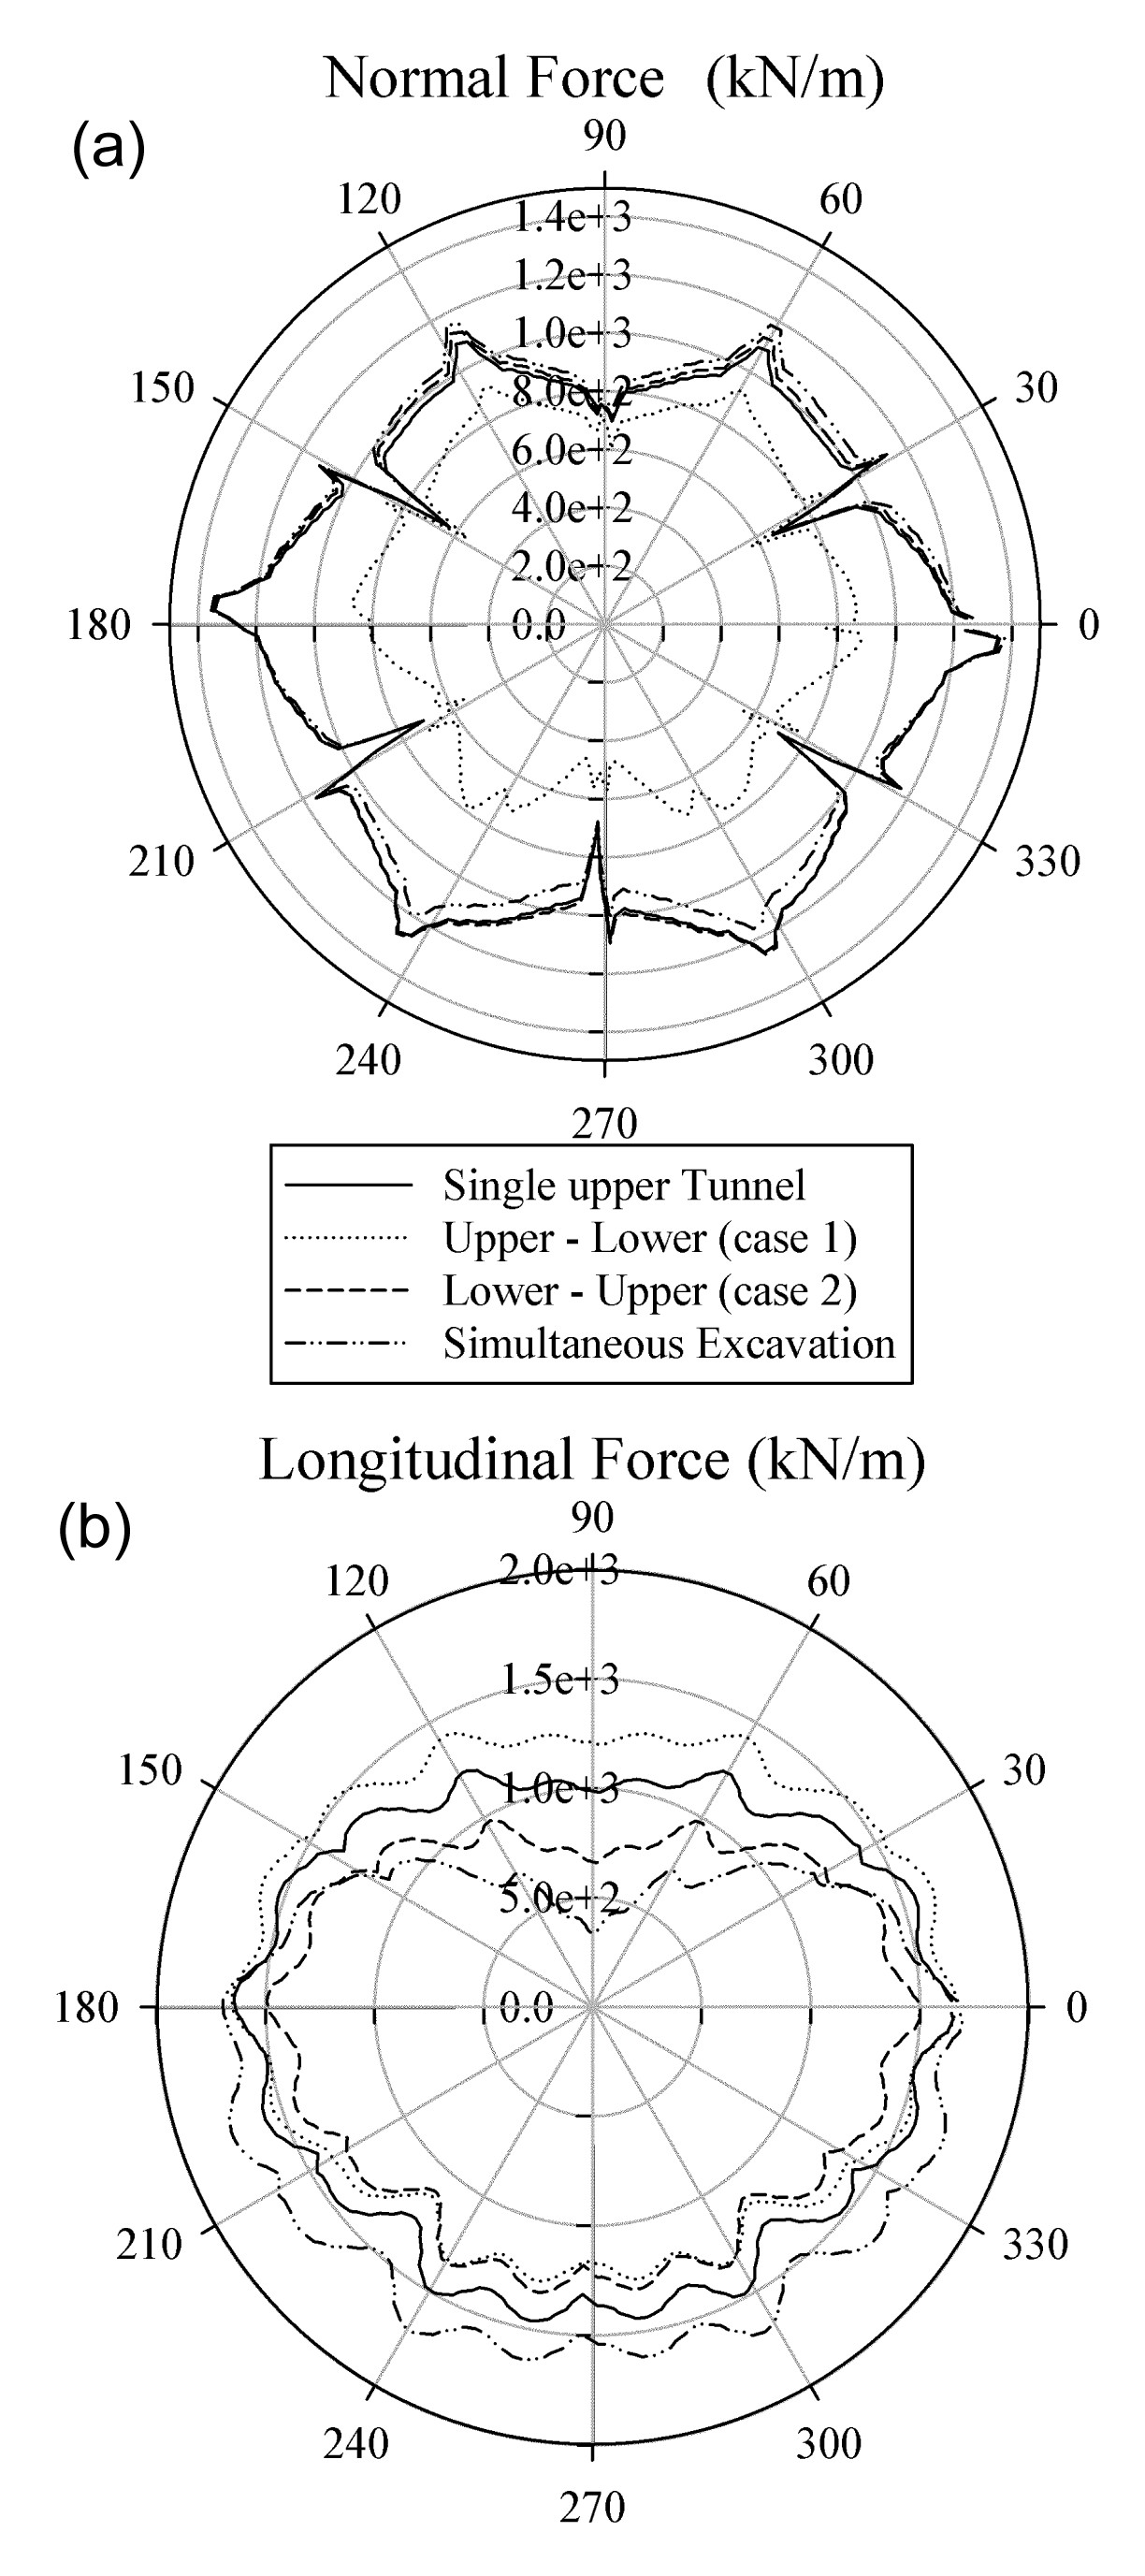
3.4. Normal forces and longitudinal forces in the tunnel lining
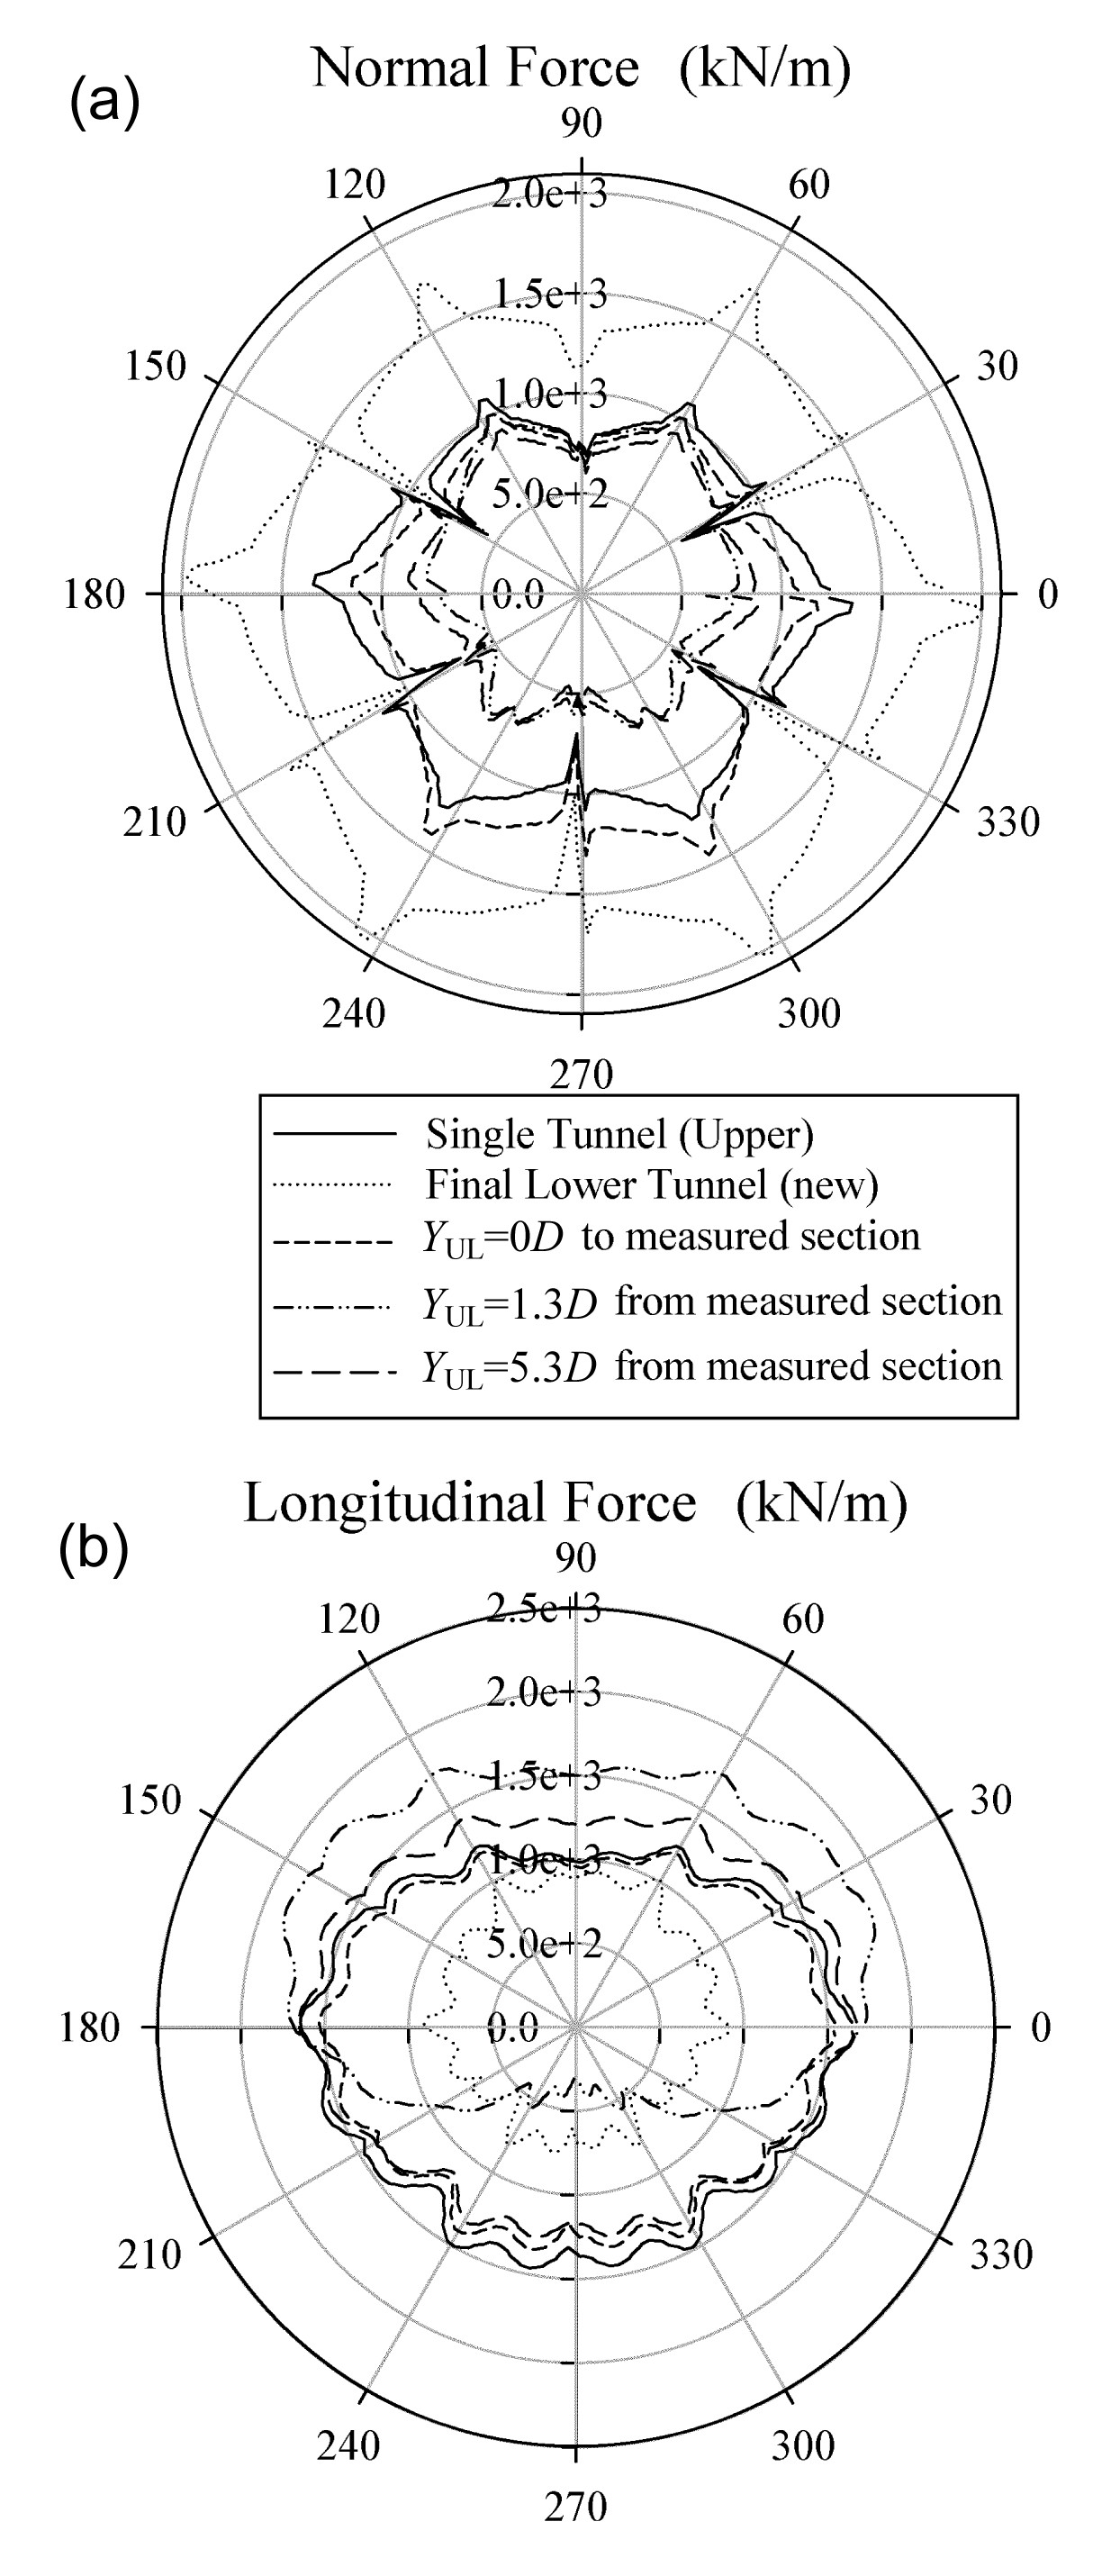
An important change in the normal forces, which act in the circumferential direction in the cross-section, induced in the measured ring of the existing (upper) tunnel during the advancement of the new (lower) tunnel (case 1) can be seen in Fig.
13a and Table
3, particularly for the bottom region of the upper tunnel near the new tunnel. When the advancement of the lower tunnel face approaches the measured section, a slight increase in the normal forces at the bottom of the upper tunnel can be observed, indicating a load transfer to the upper tunnel, due to the effect of face pressure in the lower tunnel. At the moment in which the lower tunnel face crosses the measured section, which corresponds to a distance of
Y
UL=0
D, an increase in the normal forces of 8.9% can be observed in the bottom region (Fig.
13a and Table
3).
Fig.13
Normal force and longitudinal force of the existing (upper) tunnel lining during the advancement of the new (lower) tunnel, case 1
Normal forces (a) and longitudinal forces (b) in measured lining ring 30 of the existing (upper) tunnel lining
The vertical movement of the ground towards the lower tunnel, caused by the convergence displacement along the shield in the lower tunnel, is the main reason for the decrease in the normal forces induced in the measured ring in the bottom region (see line
Y
UL=1.3
D from the measured section in Fig.
13a and Table
3). The maximum normal force in the measured lining ring in the upper tunnel, at the final state, is about 69.4% of that of a single tunnel. This suggests that a portion of the external load surrounding the upper tunnel is taken up by the lower tunnel. This could also be attributed to the fact that the upper tunnel is located in the stress relaxation zone caused by the excavation of the lower tunnel, which causes a decrease in the stresses that act on the upper tunnel lining. Note that the changes in normal forces at the crown region of the upper tunnel are insignificant during the advancement of the lower tunnel (Fig.
13a). In other words, the zones between the two tunnels are influenced more by the interaction of the two stacked tunnels.
As for the longitudinal forces (Fig.
13b), which act in the longitudinal direction of the tunnel axis and between successive lining rings, when the lower tunnel face approaches the measured section, a considerable increase of about 32.5%, measured at the bottom region in the upper tunnel, can be observed at the moment
Y
UL=−1
D (Table
3). This could be attributed to the thrust forces acting on the face of the lower tunnel. When the lower tunnel face crosses and then goes away from the measured section, the longitudinal forces in the bottom regions of the upper tunnel show a gradual decrease, while their values at the tunnel crown indicate an increase (see line
Y
UL=1.3
D from the measured section in Fig.
13b). This could be explained by the downward movement of the ground in the bottom region of the upper tunnel, between the two tunnels. The normal stresses that act on the tunnel lining in the bottom region of the upper tunnel lining, therefore, decrease. As a result, the longitudinal forces in the upper tunnel lining at these positions also decrease, due to the Poisson effect. After installation of the segmental tunnel lining in the lower tunnel, a gradual increase in longitudinal forces can be observed in the bottom region of the upper tunnel, as a result of the interaction between the two tunnels. The maximum longitudinal force in the measured lining ring of the upper tunnel, at a steady state, is similar to that of a single tunnel (Table
3).
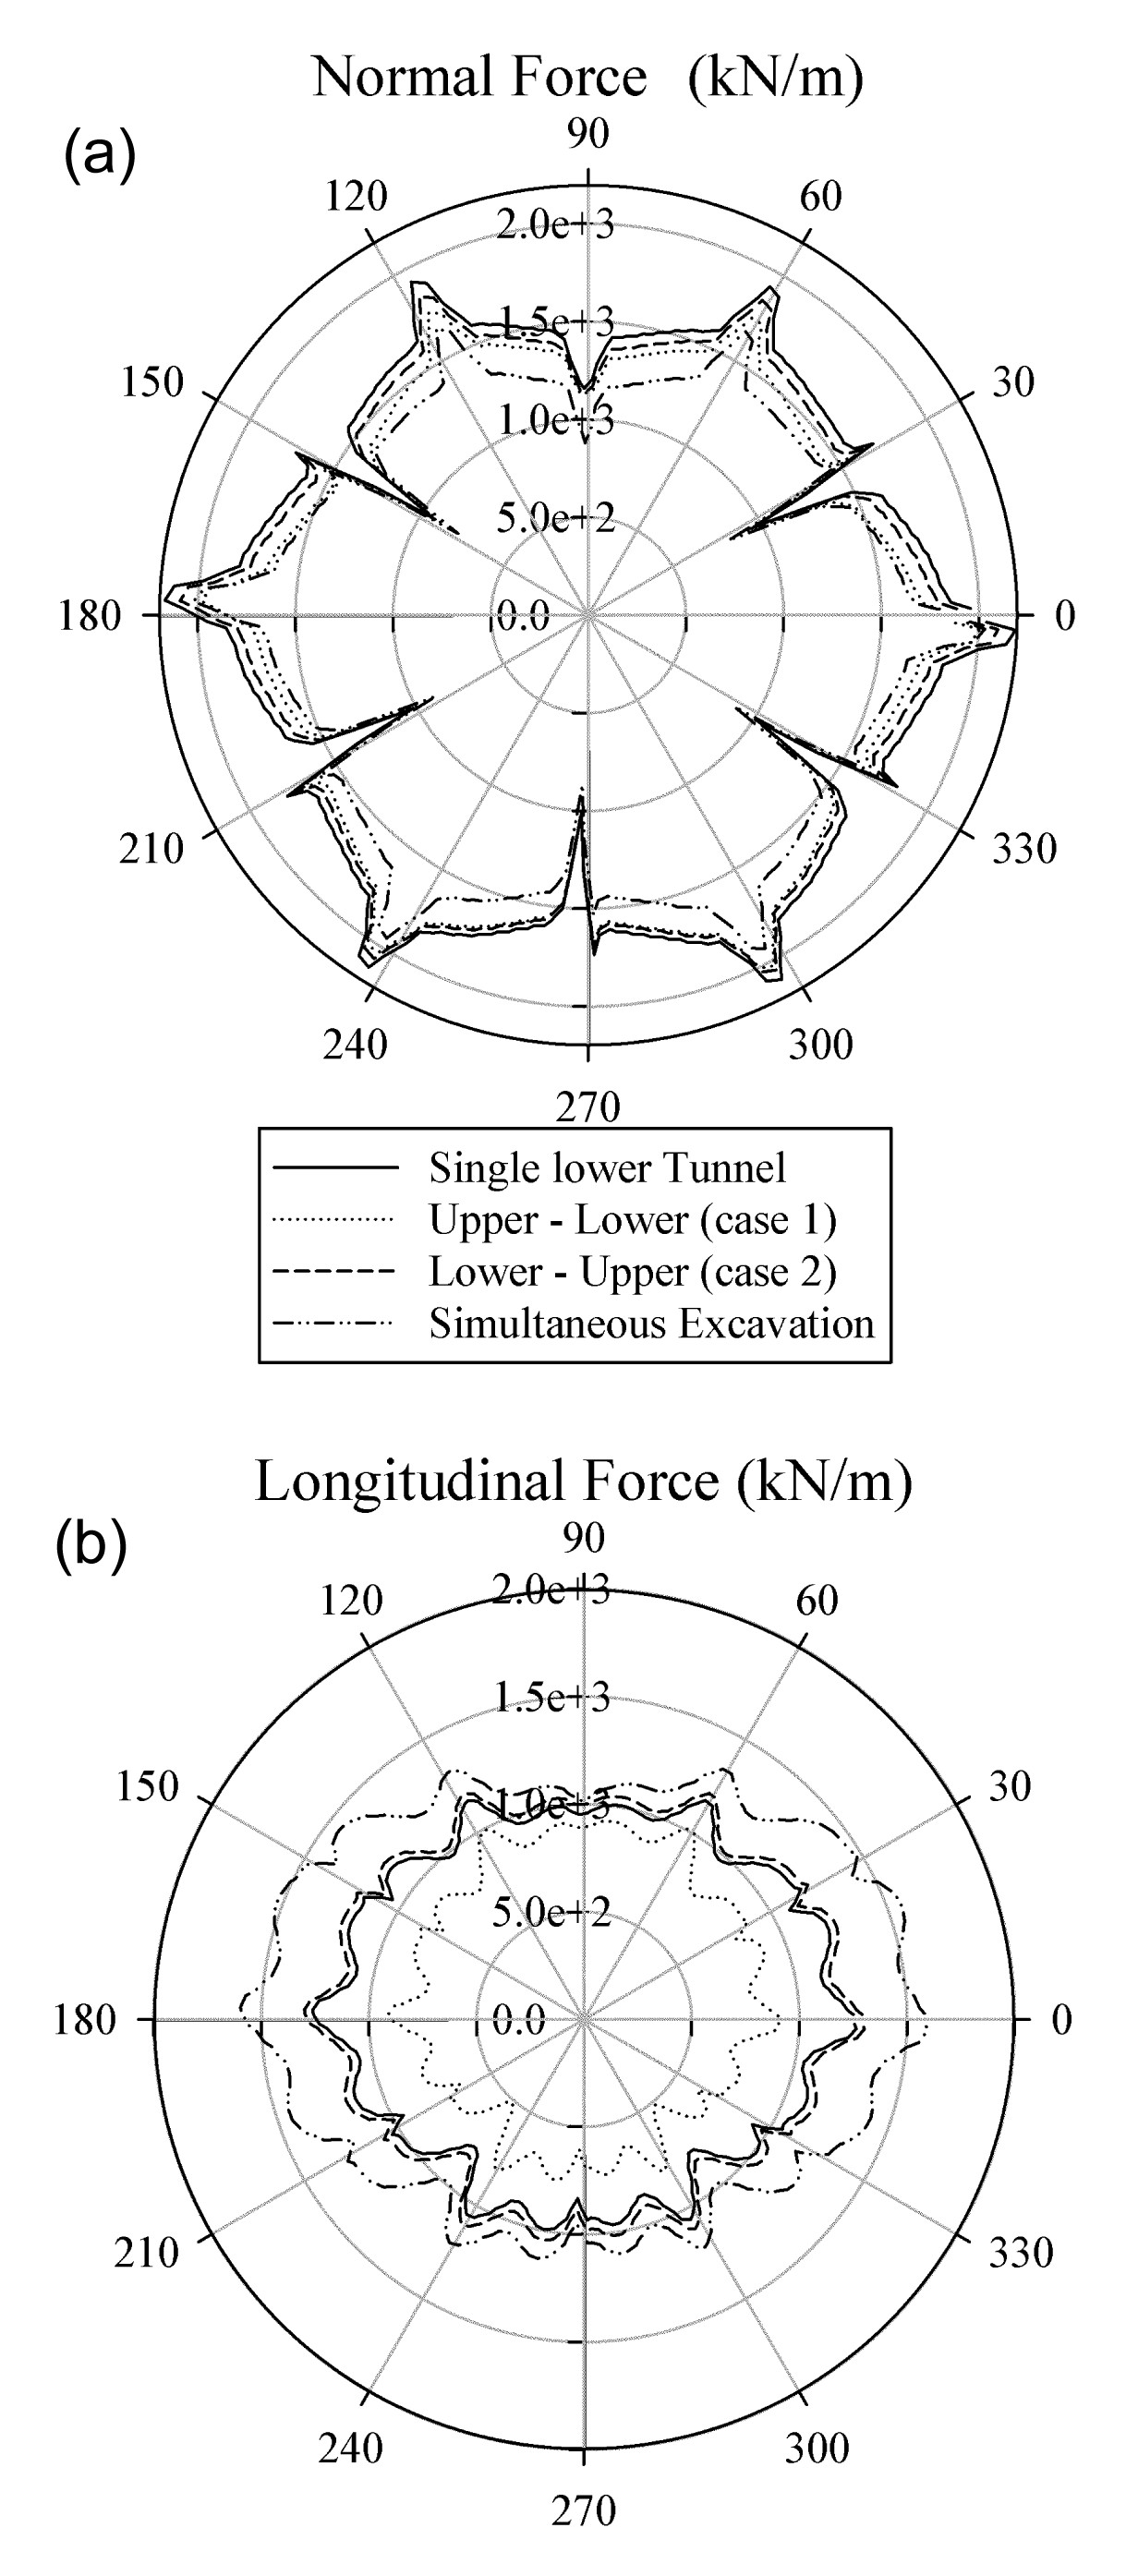
Unlike the existing (upper) tunnel, the advancement of the new (lower) tunnel shows a gradual increase in normal forces induced in the lower tunnel at the crown regions. On the other hand, the normal forces at the bottom of the lower tunnel are almost constant. The maximum normal force induced in the lower tunnel at a steady state is 116.6% higher than that in the upper tunnel (Fig.
13a and Table
3). This shows that the external forces that act on the lower tunnel lining are greater than those applied to the upper tunnel. This could be attributed to the impact of a greater stress at the lower tunnel level, due to the effect of the depth of the tunnel from the ground surface, and of the greater grouting pressure that acts at the shield tail during construction.
The numerical results indicate a gradual decrease in longitudinal forces in the lower tunnel, especially in the bottom regions. This could be explained by the impact of the jacking forces at the shield tail, which act on the segmental lining. The effect of these forces is gradually reduced as the tunnel face becomes distant. The maximum longitudinal force induced in the lower tunnel, at a steady state, is 38.9% smaller than that in the upper tunnel (Table
3 and Fig.
13b).
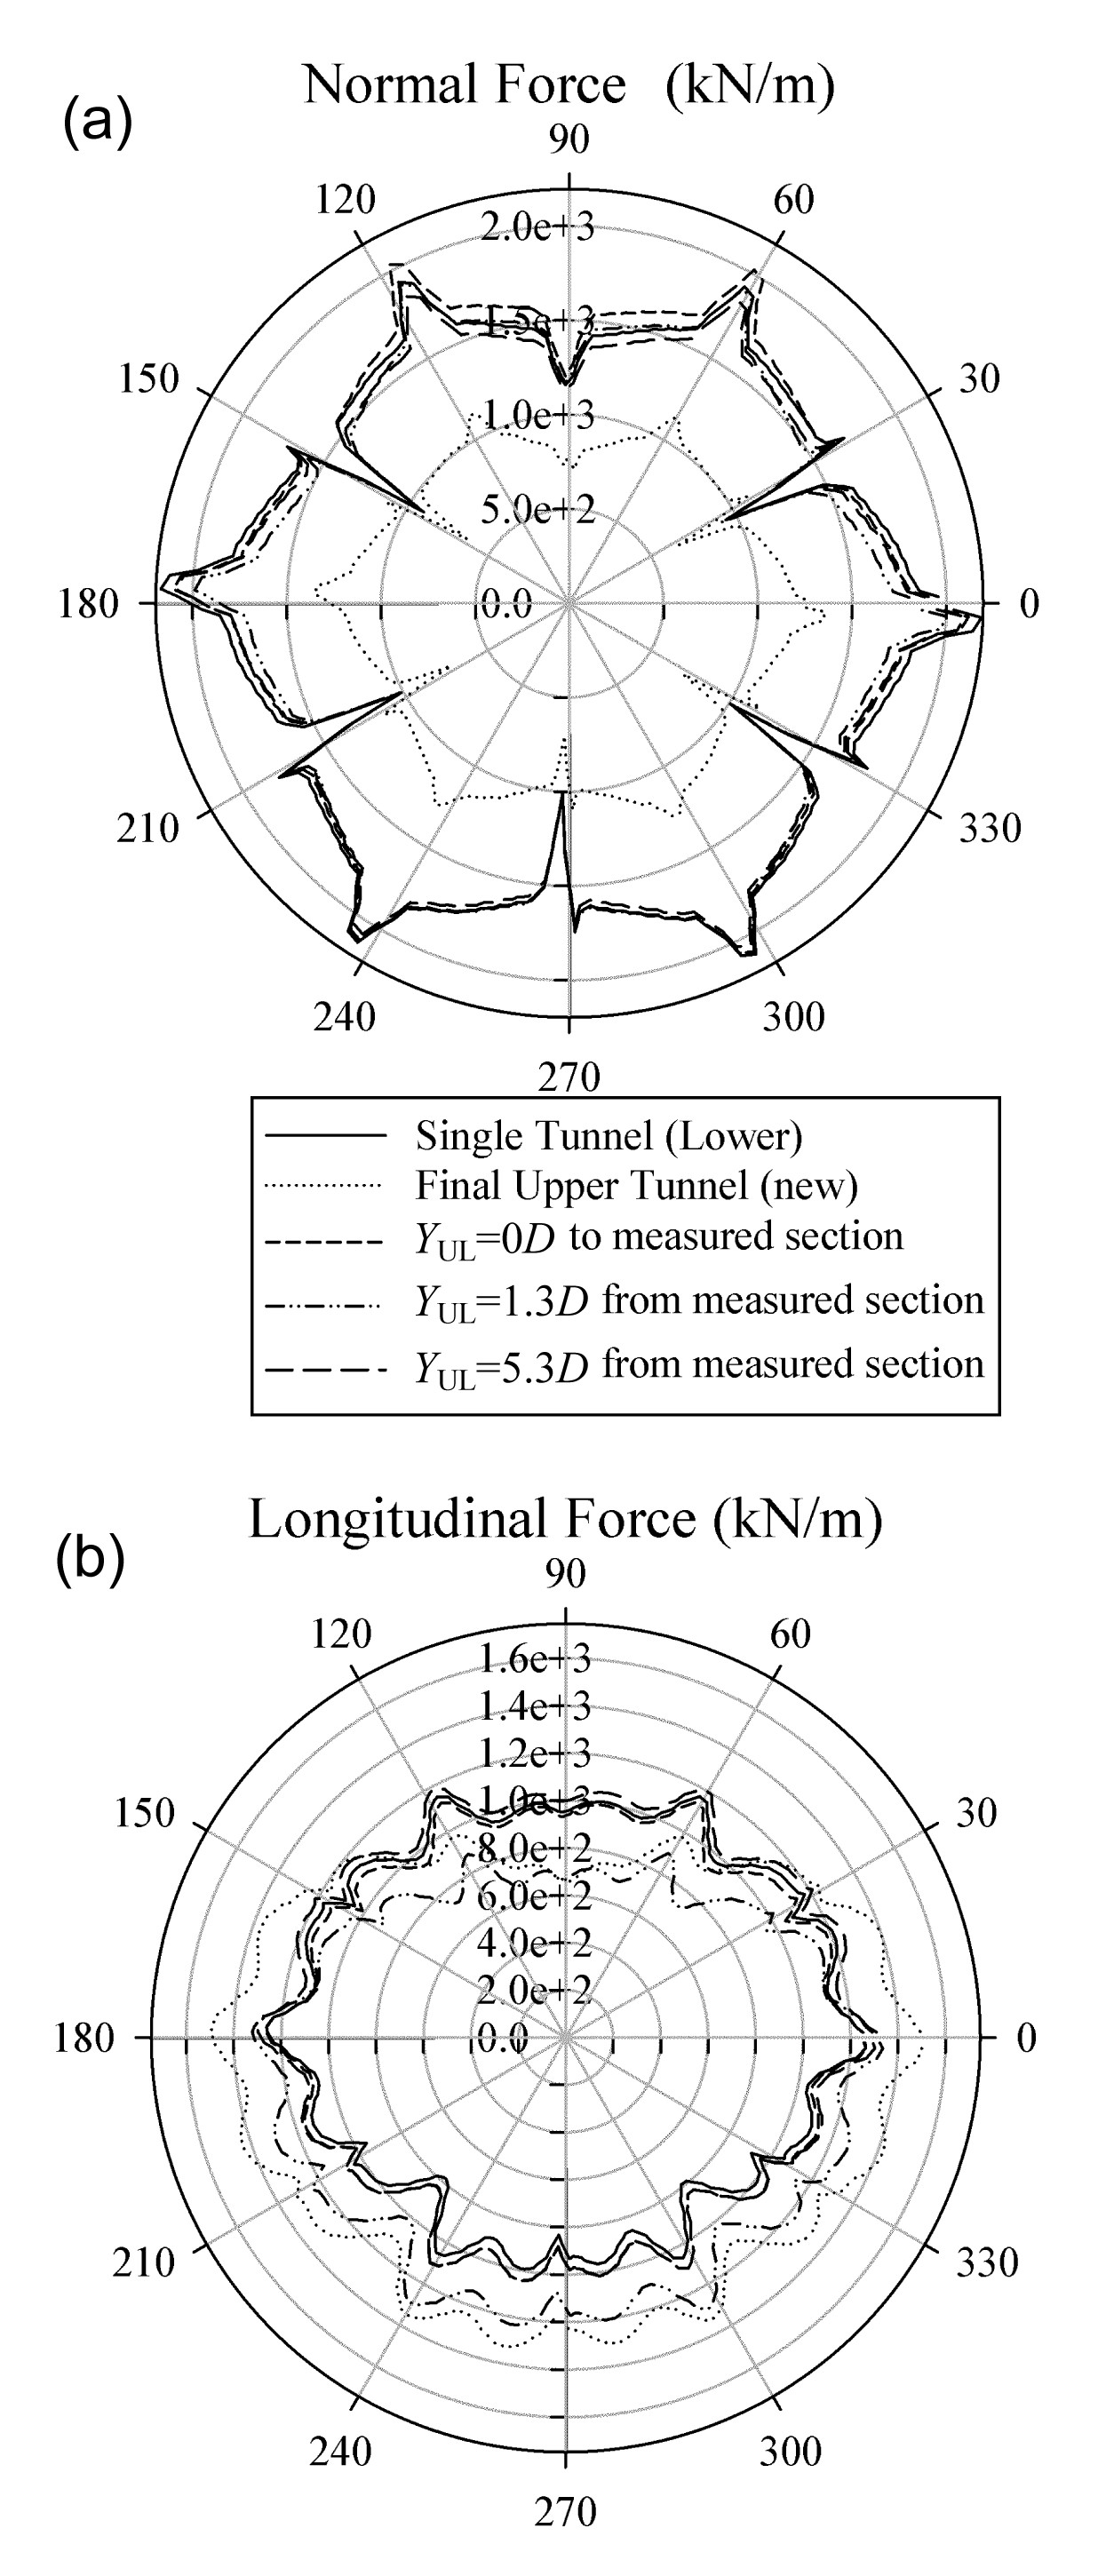
When the lower tunnel is excavated first (case 2), an insignificant impact of the new (upper) tunnel on the normal forces induced in the existing (lower) tunnel can be observed (Fig.
14a and Table
4). The normal force of the lower tunnel is generally greater than that of the upper tunnel because of different cover depths (Tables
6 and
7). However, the maximum variation in the normal force of the upper tunnel in case 1 is greater than that of the lower tunnel in case 2, i.e., case 1 is relatively disadvantageous in terms of the change in normal forces. The same conclusion was also reached from the 3D numerical results obtained by Zheng and Qiu (
2005).
Fig.14
Normal forces and longitudinal forces of the existing (lower) tunnel lining during the advancement of the new (upper) tunnel, case 2
Normal forces (a) and longitudinal forces (b) in measured lining ring 30 of the existing (lower) tunnel lining
A considerable change in the longitudinal forces in the lower tunnel lining can instead be observed in Fig.
14b, especially at the crown region near the new tunnel. However, the maximum values of the two forces above at a steady state are similar to those of a single, lower tunnel (Table
4).
The numerical results indicate significant changes in the normal forces and longitudinal forces in the upper tunnel, particularly in the bottom region, during advancement of the new (upper) tunnel. When the tunnel face is distant, the maximum values of the normal forces and longitudinal forces induced in the lower tunnel are about 152.8% and 87.1%, respectively, of those induced in the upper tunnel (Fig.
14 and Table
4).
The results of the normal forces obtained in this study are different from those obtained by Hefny et al. (
2004) using a 2D simulation. Through a parametric study on the effect of a new tunnel excavation on an existing tunnel, Hefny et al. (
2004) showed that when a new tunnel is driven above an existing tunnel, the existing tunnel experiences a decrease in the maximum axial force. This conclusion is in good agreement with the results observed in the present study. However, Hefny et al. (
2004) pointed out that the excavation of the new tunnel below the existing tunnel has a negligible effect on the maximum axial force induced in the lining. This observation is inconsistent with the results of the present study, which show a significant decrease in normal forces. The difference could be attributed to the effect of the 3D mechanized tunnelling process used in the present study, which was not applied in the study of Hefny et al. (
2004).
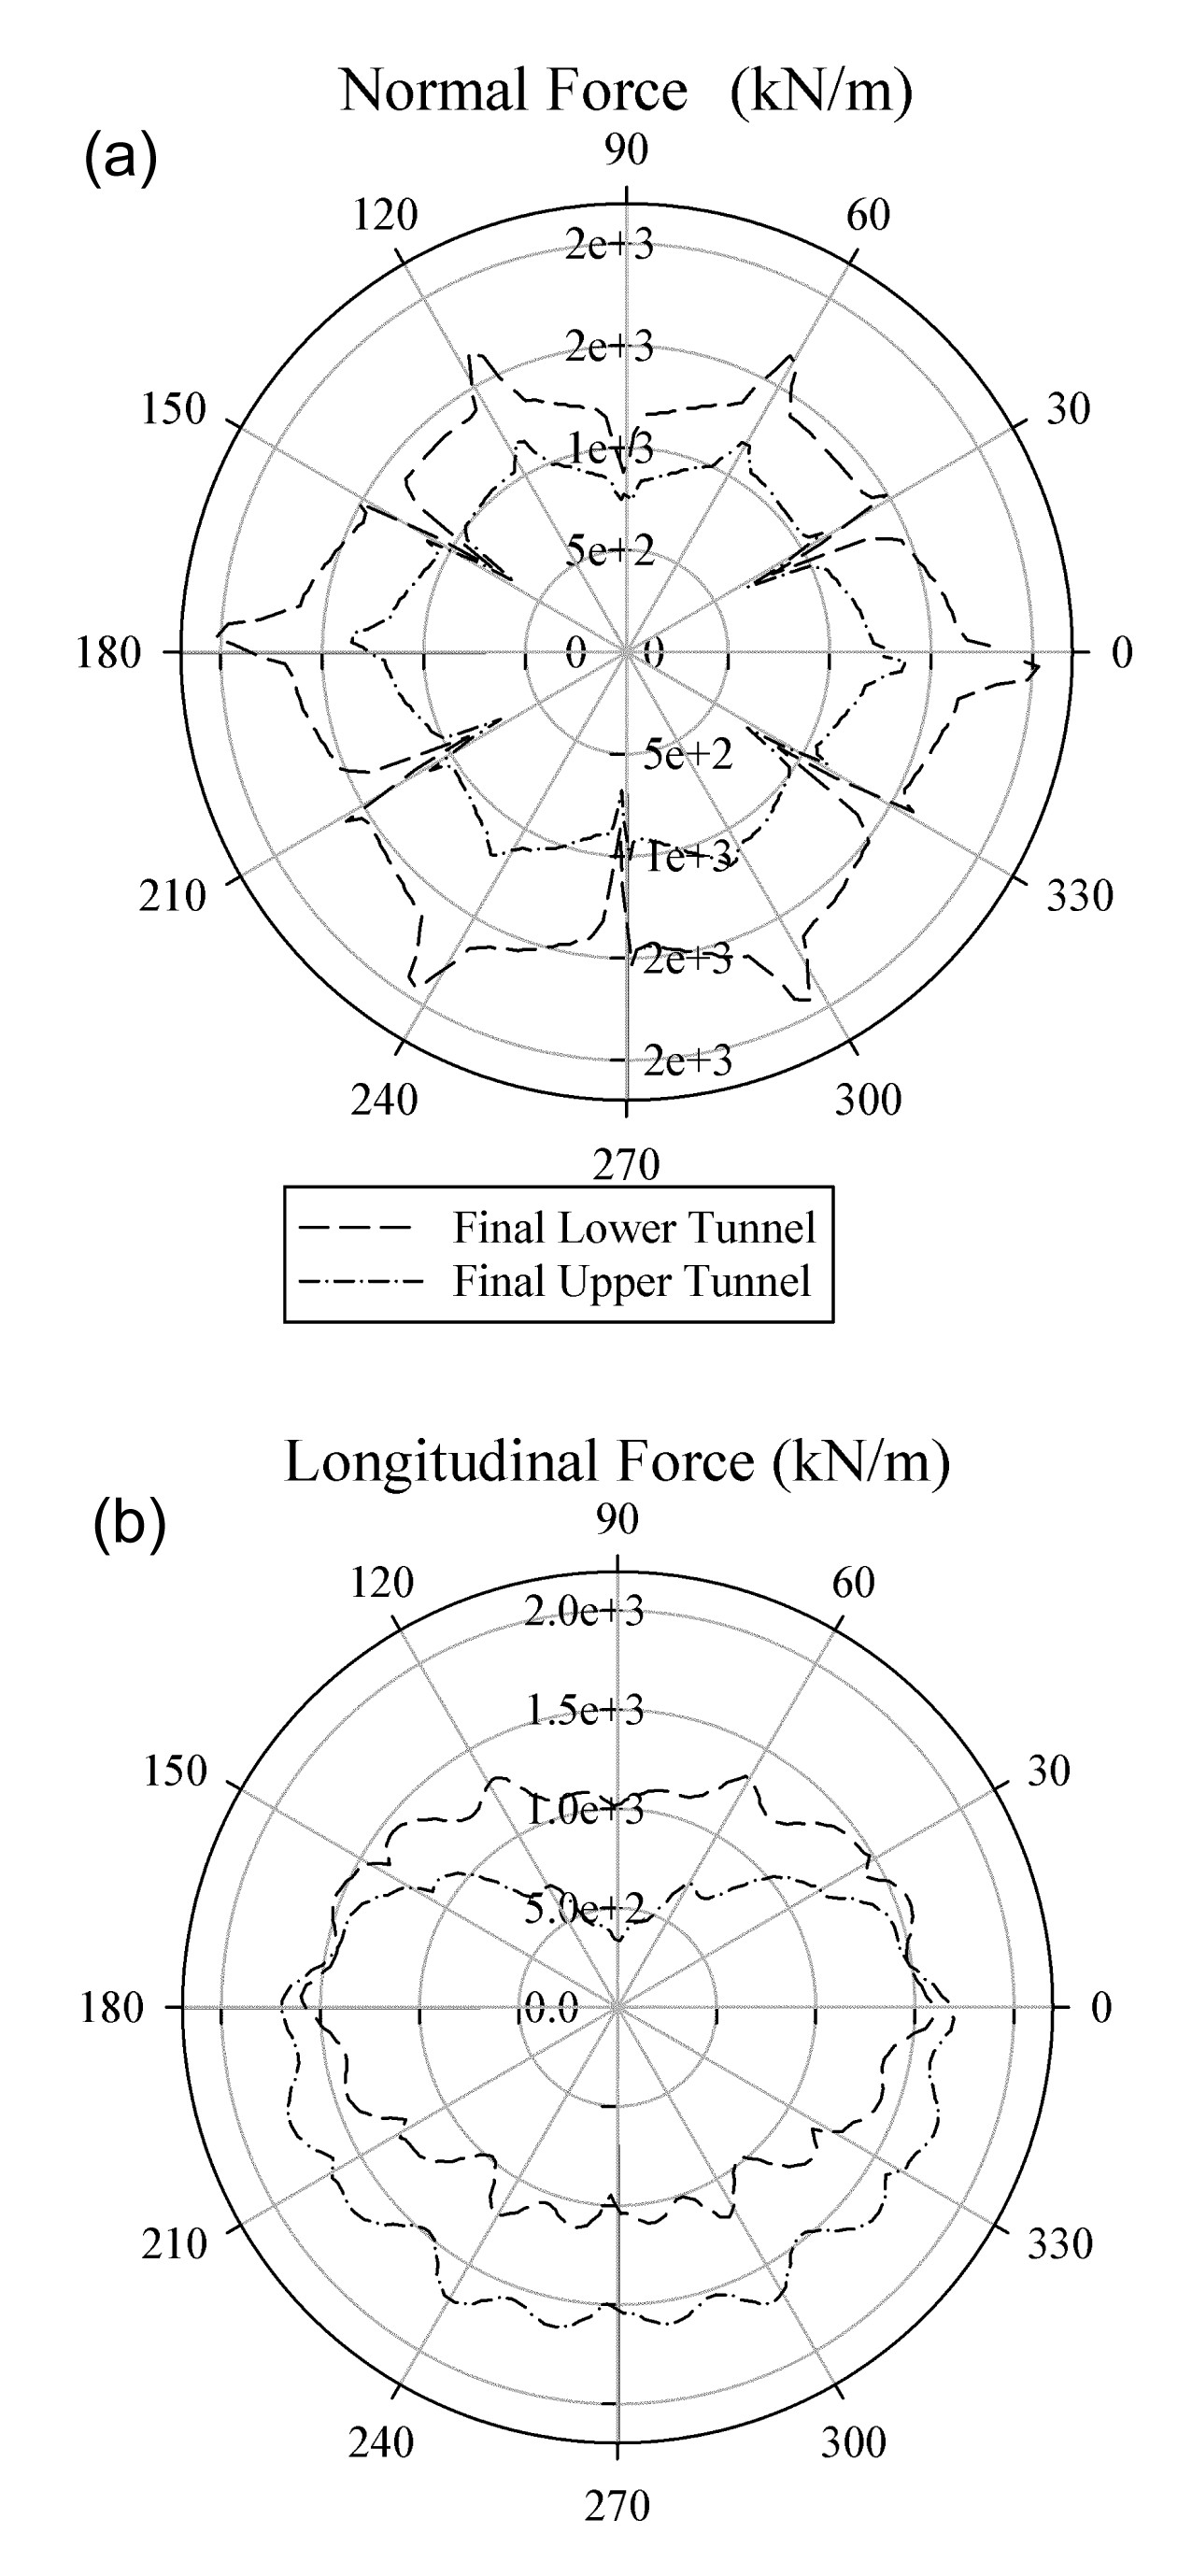
In the case of two stacked tunnels excavated simultaneously (case 3), the numerical results show that the normal forces induced in the two tunnels are similar in shape, but their values in the lower tunnel are significantly higher than those in the upper tunnel (Fig.
15a and Table
5). The longitudinal forces developed in the upper tunnel are larger in the bottom region and smaller in the crown region compared to those induced in the lower tunnel (Fig.
15b). This could be attributed to the important interaction in the ground zone between the two tunnels.
Fig.15
Normal forces and longitudinal forces of the stacked tunnel linings, case 3
Normal forces (a) and longitudinal forces (b) in measured lining ring 30 of the stacked tunnel linings
To illustrate the effect of the tunnelling procedure on tunnel behaviour, Figs.
16 and
17 (p.908–909), and Tables
6 and
7 show comparisons between the normal and longitudinal forces developed in the tunnel lining for the three cases considered. Fig.
16 shows that the tunnelling procedure has a considerable influence on both the longitudinal and the normal forces in the upper tunnel, especially for case 1. However, as for the lower tunnel, the normal forces in the tunnel lining do not seem to be affected by the tunnelling procedure (Fig.
17).
Fig.16
Comparison of the normal forces and longitudinal forces of the upper tunnel lining
Normal forces (a) and longitudinal forces (b) in measured lining ring 30 of the upper tunnel lining
Fig.17
Comparison of the normal forces and longitudinal forces of the lower tunnel lining
Normal forces (a) and longitudinal forces (b) in measured lining ring 30 of the lower tunnel lining
Note that the maximum normal and longitudinal forces in both stacked tunnels, for case 2, are similar to those of a corresponding single tunnel. However, as for case 1, the maximum values induced in the two stacked tunnels are generally smaller than those in a single tunnel (Tables
6 and
7). In other words, except for the longitudinal force in the upper tunnel, case 1, in which the upper tunnel is excavated first, leads to smaller internal forces in both stacked tunnels than case 2, in which the lower tunnel is excavated first.
The above results differ from those obtained through 2D numerical investigations by Hage Chehade and Shahrour (
2008) and Channabasavaraj and Vishwanath (
2012). They concluded that the construction of the upper tunnel first leads to higher structural forces in the tunnel lining than those developed when the lower tunnel is constructed first. This discrepancy could be attributed to the fact that the influence of the main construction aspects of a mechanized tunnelling excavation process was not simulated in their 2D analyses.
The simultaneous excavation of both tunnels (case 3) causes larger longitudinal forces in both stacked tunnels than in the two other cases (Figs.
16b and
17b, and Tables
6 and
7).
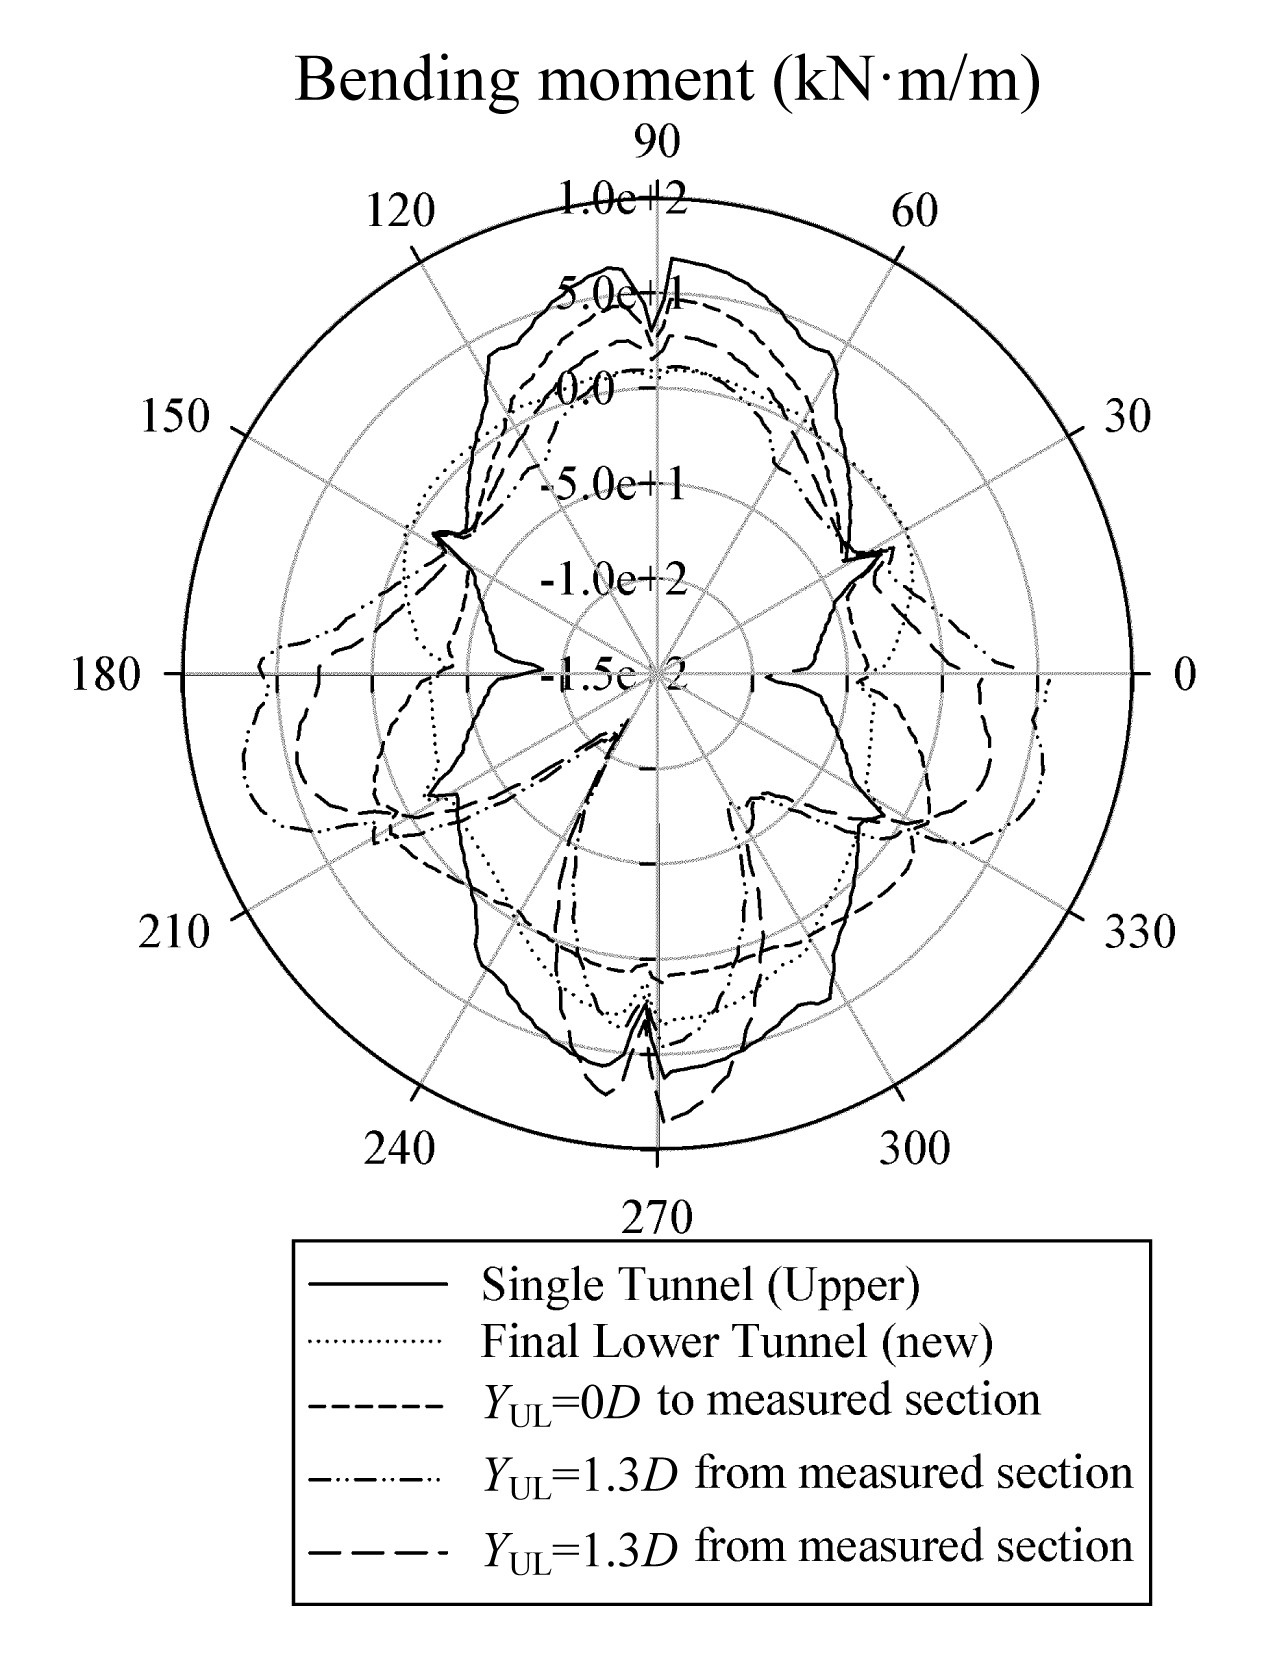
3.5. Bending moment in the tunnel lining
The distribution of the bending moment in the measured ring of the upper tunnel for case 1 can be seen in Fig.
18. The excavation of the new (lower) tunnel causes important changes in the bending moment in the upper tunnel. In particular, changes in the bending moment, from negative to positive values, can be observed on the two lower sides of the upper tunnel near the spring line regions, while changes from positive to negative values can be observed near the tunnel base, during the advancement of the new (lower) tunnel. This could be attributed to the downward movements of the soil above the lower tunnel during the advancement of the lower tunnel. For the same reason, a decrease in the positive bending moment induced at the bottom of the upper tunnel, when the shield machine in the lower tunnel passes over the measured section in the upper tunnel, can also be observed in Fig.
18 (see line
Y
UL=0
D). However, an increase in the positive bending moment at the tunnel bottom can then be seen during the passage of the shield tail in the lower tunnel (see line
Y
UL=1.3
D in Fig.
18). This could be attributed to the effect of the grouting pressure at the shield tail of the shield machine in the lower tunnel. These phenomena are different from those observed in the 3D numerical study by Zheng and Qiu (
2005), who found a decrease in the positive bending moment at the bottom of the existing (upper) tunnel caused by the passage of the new (lower) tunnel. Note that the effects of grouting pressure, jacking force, and shield weight were not considered in (Zheng and Qiu,
2005).
Fig.18
Bending moment in measured lining ring 30 of the existing (upper) tunnel lining, case 1
As for the lower tunnel, the numerical results show a gradual increase in the positive bending moment at the crown and bottom regions, and a negative bending moment at the two tunnel sides (due to the low
K
0 value of 0.5). The absolute values of the maximum and minimum bending moments induced in the lower tunnel are about 43.6% and 42.3%, respectively, at the final state, of those developed in the upper tunnel (Fig.
18 and Table
3). An important difference in the shape of the bending moment, at a steady state, induced in the two stacked tunnels in case 1, can also be observed in Fig.
18.
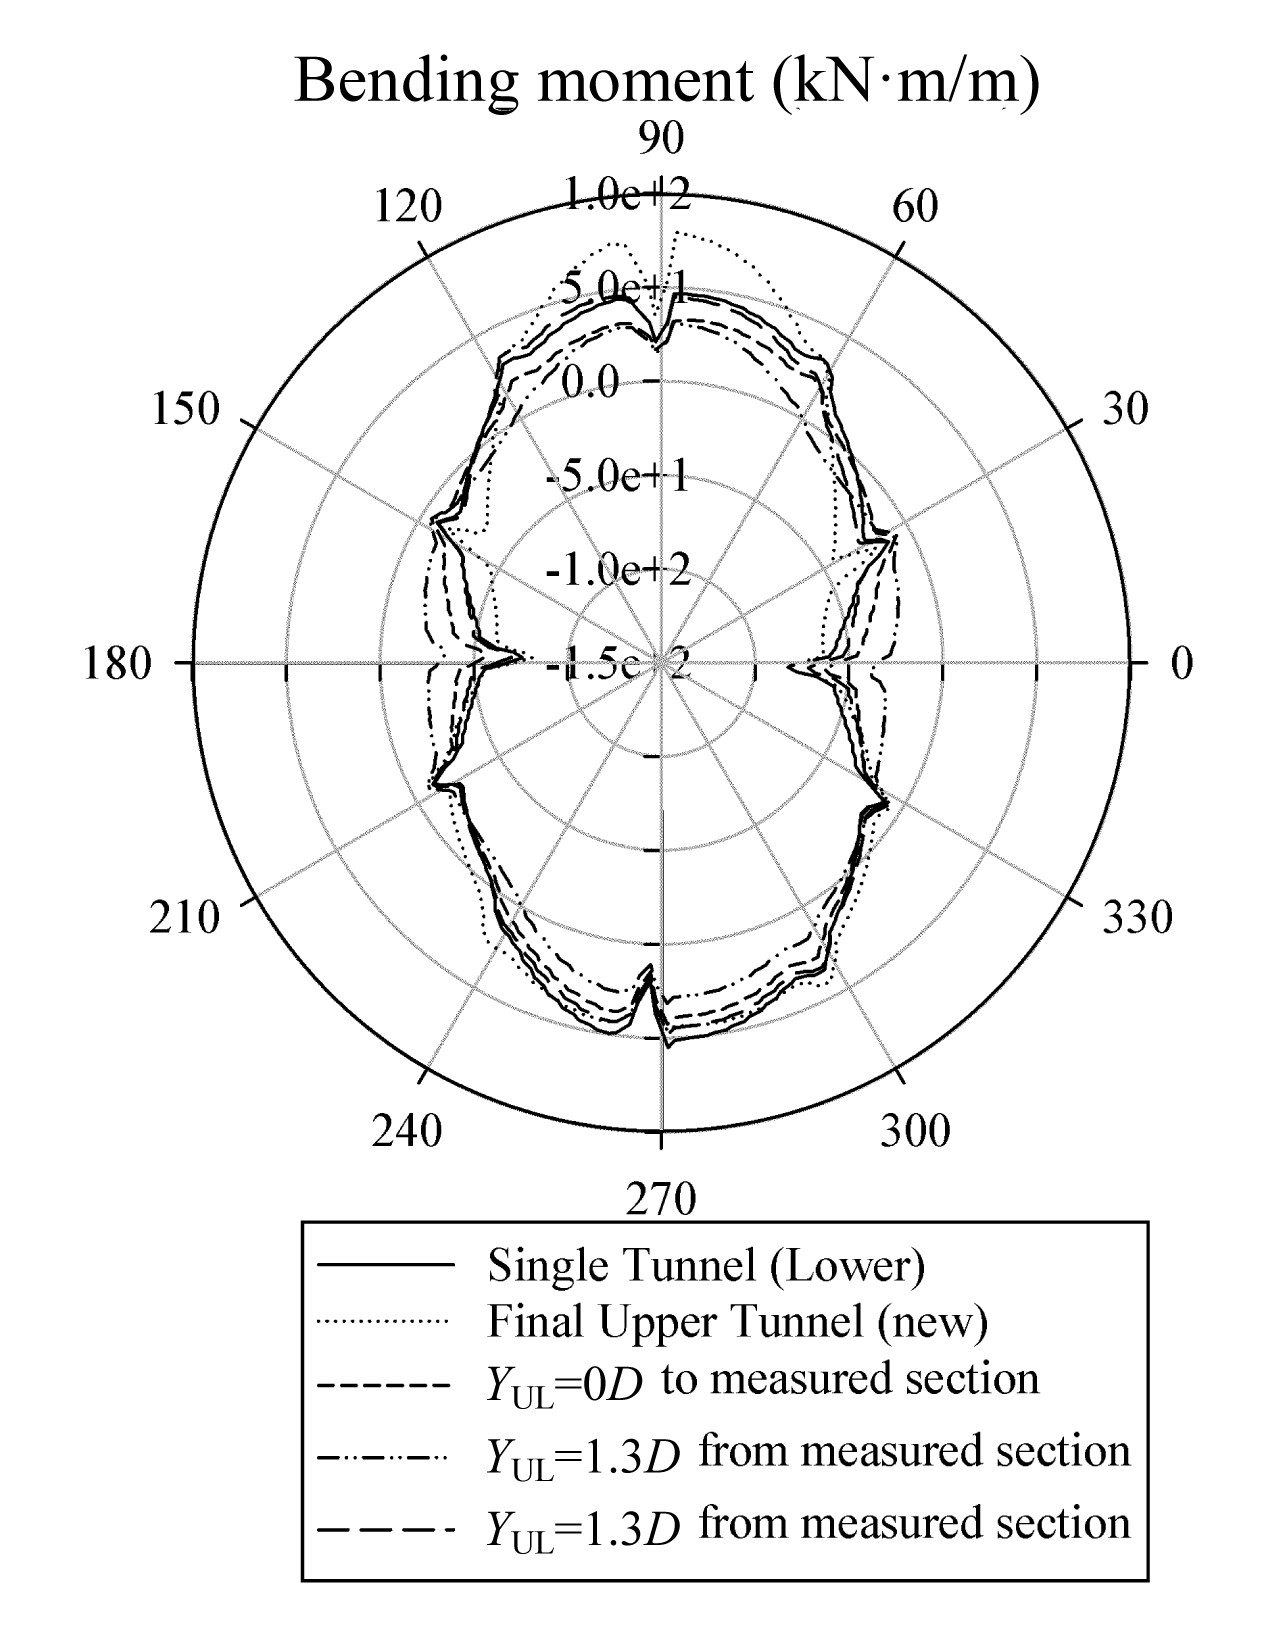
As for case 2, in which the lower tunnel is excavated first, Fig.
19 shows a slight decrease in bending moment in the crown region of the lower tunnel during the advancement of the new (upper) tunnel. This could be explained by the upward vertical movement of the soil at the bottom of the upper tunnel, due to the low earth lateral pressure coefficient value (
K
0=0.5). The bending moments induced in the upper tunnel show a gradual increase. When the upper tunnel face is at a distance, the absolute values of the maximum and minimum bending moments in the lower tunnel are about 66.3% and 87.5%, respectively, of those in the upper tunnel (Fig.
19 and Table
4). Unlike for case 1, Figs.
19 and
20 indicate similar shapes of the bending moment induced in the two stacked tunnels for both case 2 and case 3.
Fig.19
Bending moment in measured lining ring 30 of the existing (lower) tunnel lining, case 2
Fig.20
Bending moment in the measured lining ring of the stacked tunnel linings, case 3
The bending moments induced in the lower tunnel are normally smaller than those in the upper tunnel (Tables
3 and
4). This means that, although the external loads that act on the lower tunnel lining are always higher than those acting on the upper tunnel, as mentioned in Section 3.4, the external loads determined in the lower tunnel are more uniform than those applied in the upper tunnel. This conclusion is in good agreement with the smaller deformation induced in the lower tunnel mentioned in Section 3.3.
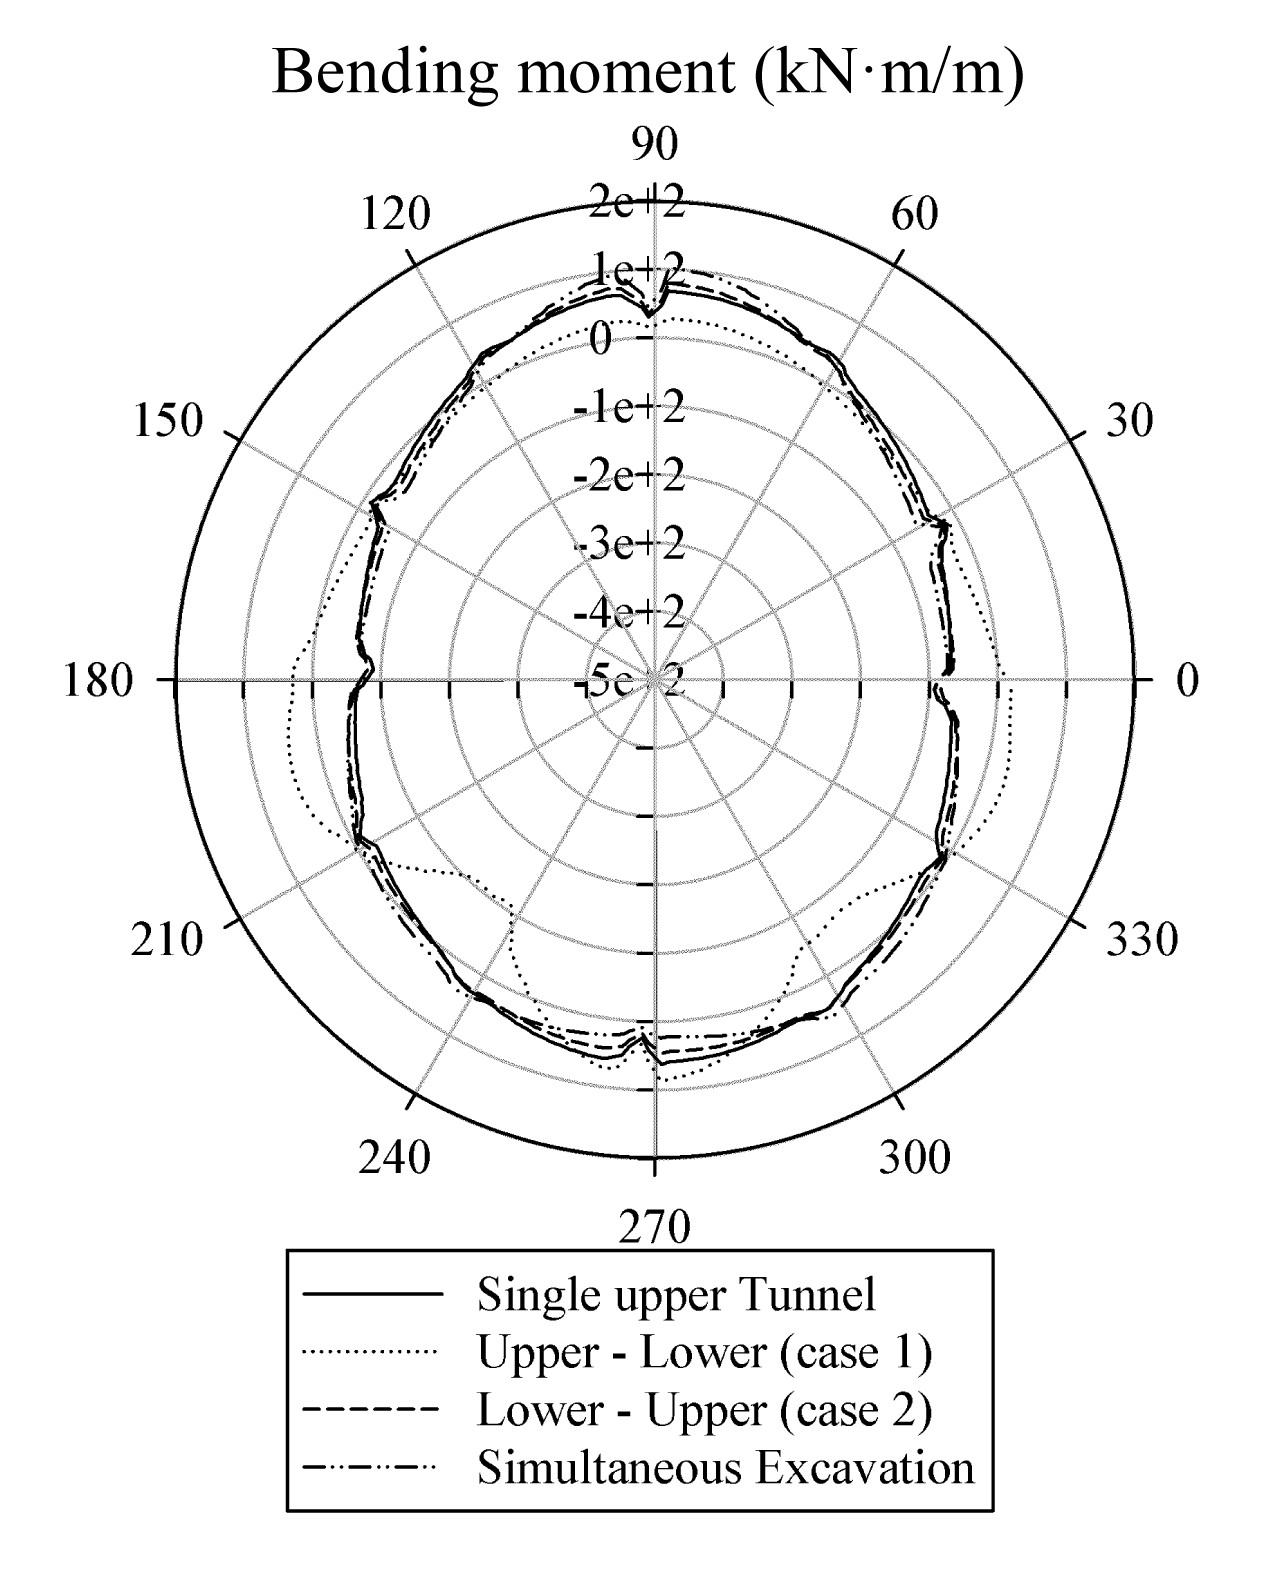
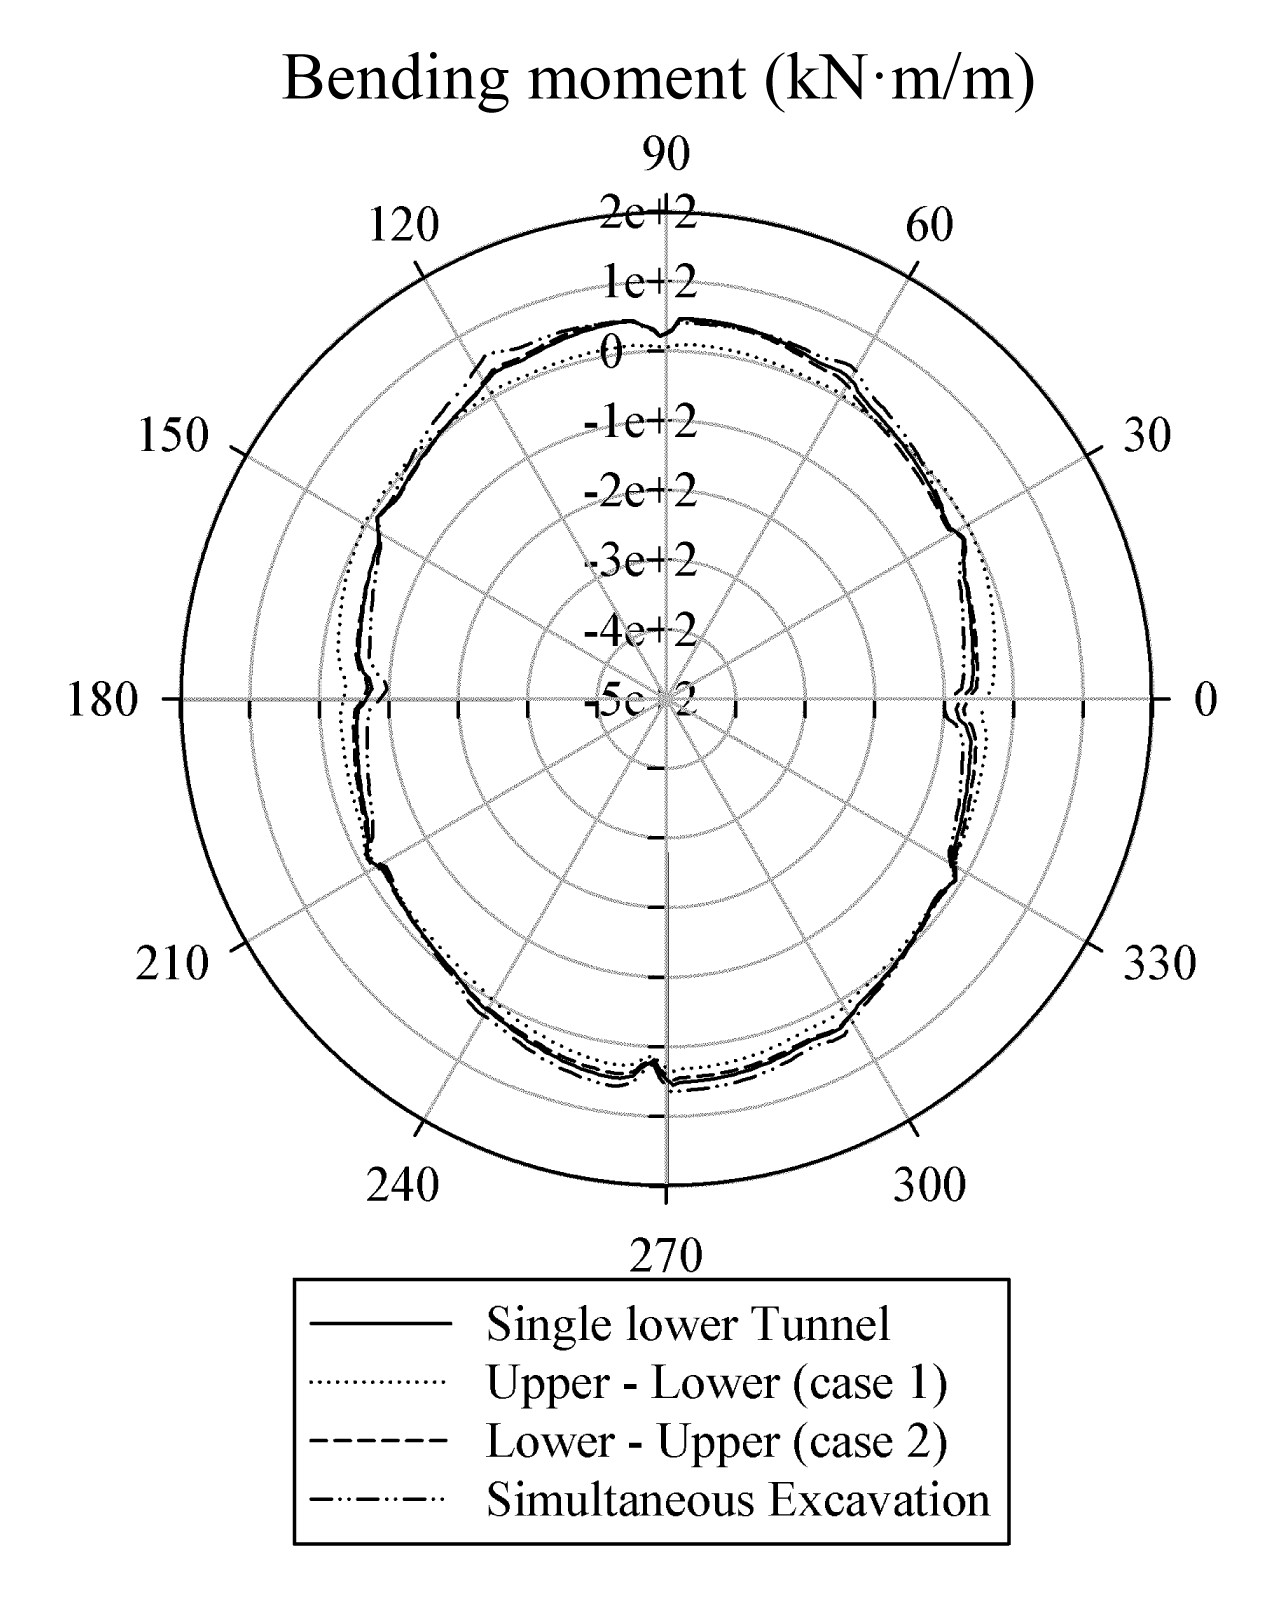
Comparisons of the bending moments induced in the stacked tunnel linings are presented in Figs.
21 and
22, and Tables
6 and
7 for the three cases considered. The tunnelling procedure has a considerable effect on the bending moment in the upper tunnel, especially in case 1. However, as for the lower tunnel, the bending moment in the tunnel lining does not seem to be affected by the tunnelling procedure (Fig.
22).
Fig.21
Comparison of the bending moment in measured lining ring 30 of the upper tunnel lining
Fig.22
Comparison of the bending moment in measured lining ring 30 of the lower tunnel lining
Note that the successive excavation of stacked tunnels, i.e., case 1 and case 2, always causes an increase in the maximum bending moment induced in the upper tunnel at the final state (Table
6). However, a decrease in the maximum bending moment induced in the lower tunnel is usually observed (Table
7).
4. Conclusions
A 3D numerical model of the mechanized twin stacked tunnelling process was developed in this study. The excavation of a new tunnel was shown to have an important impact on both the behaviour of the linings installed in the existing tunnel and the displacements of the ground surrounding the twin stacked tunnels. The structural forces induced in the existing tunnel change during advancement of the new tunnel. The maximum interaction between the two tunnels occurs when the shield of the new tunnel passes over the measured section. The greatest impacts were observed for case 1, in which the upper tunnel is excavated first. On the basis of the results of the 3D numerical analyses, it is possible to draw the following conclusions:
-
An increase in the surface settlement, compared to that induced above a single tunnel, can be expected due to interactions between the twin stacked tunnels. The tunnelling procedure is responsible for the differences in surface settlement that develop during the excavation of each tunnel. The excavation of the upper tunnel first causes a greater surface settlement than excavation in the other two cases.
-
The lateral displacements are greatly affected by the tunnel depth and tunnelling procedure. The deeper the tunnel is, the smaller the lateral displacement is. The case in which the lower tunnel is excavated first causes a greater lateral displacement.
-
The normal deformations in the upper tunnel are always greater than those developed in a single tunnel. Unlike the upper tunnel, the normal deformations induced in the lower tunnel are usually smaller than those developed in a single tunnel, except for case 3, in which two stacked tunnels are excavated simultaneously. In other words, the normal displacements induced in the lower tunnel are usually smaller than those developed in the upper tunnel.
-
The normal forces induced in the lower tunnels are always greater than those developed in the upper tunnel, due to the impact of the higher stress at a greater depth. Case 1, in which the upper tunnel is excavated first, leads to smaller normal forces than case 2. The simultaneous excavation of both tunnels causes greater longitudinal forces in both stacked tunnels.
-
The bending moments induced in the lower tunnel are usually smaller than those in the upper tunnel. This means that the external loads that act on the lower tunnel lining are more uniform than those applied in the upper tunnel. This conclusion is supported by the finding that a smaller deformation is induced in the lower tunnel.
-
Except for the maximum normal forces in the lower tunnel, which are more or less similar in all three cases, the maximum structural forces induced in both stacked tunnels for case 3 are generally greater than those obtained for case 1 and case 2.
-
The successive excavation of stacked tunnels, i.e., case 1 and case 2, causes an increase in the maximum bending moment in the upper tunnel and a decrease in the bending moment in the lower tunnel at the final state.
-
The upper tunnel is affected to a greater extent by the excavation procedure.
Note that the numerical investigation in this study is applied to drained conditions and to a homogeneous soil. Experimental studies are needed to validate the numerical results obtained in this study.
Acknowledgements
The authors wish to thank Mrs. Marguerite JONES from the Politecnico of Torino, Italy for her contribution to the paper.
References
[1] Afifipour, M., Sharifzadeh, M., Shahriar, K., 2011. Interaction of twin tunnels and shallow foundation at Zand underpass, Shiraz metro, Iran.
Tunnelling and Underground Space Technology, 26(2):356-363.

[2] Chakeri, H., Hasanpour, R., Hindistan, M.A., 2011. Analysis of interaction between tunnels in soft ground by 3D numerical modelling.
Bulletin of Engineering Geology and the Environment, 70(3):439-448.
[3] Channabasavaraj, W., Vishwanath, B., 2012. Influence of relative position of the tunnels—numerical analysis on interaction between twin tunnels.
, Proceedings of Indian Geotechnical Conference, Delhi, India, 500-503. :500-503.
[4] Chapman, D.N., Ahn, S.K., Hunt, D.V.L., 2007. Investigating ground movements caused by the construction of multiple tunnels in soft ground using laboratory model tests.
Canadian Geotechnical Journal, 44(6):631-643.
[5] Chen, R.P., Zhu, J., Liu, W., 2011. Ground movement induced by parallel EPB tunnels in silty soils.
Tunnelling and Underground Space Technology, 26(1):163-171.
[6] Choi, J.I., Lee, S., 2010. Influence of existing tunnel on mechanical behaviour of new tunnel.
KSCE Journal of Civil Engineering, 14(5):773-783.
[7] Dias, D., Kastner, R., 2013. Movements caused by the excavation of tunnels using face pressurized shields—analysis of monitoring and numerical modelling results.
Engineering Geology, 152(1):17-25.
[8] Dias, D., Kastner, R., Maghazi, M., 2000. Three Dimensional Simulation of Slurry Shield Tunnelling.
Geotechnical Aspects of Underground Construction in Soft Ground, Balkema, Rotterdam :351-356.
[9] Divall, S., Goodey, R.J., Taylor, R.N., 2012. Ground movements generated by sequential twin-tunnelling in over-consolidated clay.
, 2nd European Conference on Physical Modelling in Geotechnics, Delft, The Netherlands, :
[10] Do, N.A., Dias, D., Oreste, P.P., 2013. 2D numerical investigation of segmental tunnel lining behaviour.
Tunnelling and Underground Space Technology, 37:115-127.
[11] Do, N.A., Dias, D., Oreste, P.P., 2014. Three-dimensional numerical simulation for mechanized tunnelling in soft ground: the influence of the joint pattern.
Acta Geotechnica, 9(4):673-694.
[12] Do, N.A., Dias, D., Oreste, P.P., 2014. Three-dimensional numerical simulation of a mechanized twin tunnels in soft ground.
Tunnelling and Underground Space Technology, 42:40-51.
[13] Do, N.A., Dias, D., Oreste, P.P., 2014. 2D tunnel numerical investigation: the influence of the simplified excavation method on tunnel behaviour.
Geotechnical and Geological Engineering, 32(1):43-58.
[14] Do, N.A., Dias, D., Oreste, P.P., 2014. 3D numerical investigation on the interaction between mechanized twin tunnels in soft ground.
Environmental Earth Sciences, in press,:
[15] Ercelebi, S.G., Copour, H., Ocak, I., 2011. Surface settlement predictions for Istanbul metro tunnels excavated by EPB-TBM.
Environmental Earth Sciences, 62(2):357-365.
[16] Hage Chehade, F., Shahrour, I., 2008. Numerical analysis of the interaction between twin-tunnels: influence of the relative position and construction procedure.
Tunnelling and Underground Space Technology, 23(2):210-214.
[17] Hasanpour, R., Chakeri, H., Ozcelik, Y., 2012. Evaluation of surface settlements in the Istanbul metro in terms of analytical, numerical and direct measurements.
Bulletin of Engineering Geology and the Environment, 71(3):499-510.
[18] He, C., Feng, K., Fang, Y., 2012. Surface settlement caused by twin-parallel shield tunnelling in sandy cobble strata.
Journal of Zhejiang University-SCIENCE A (Applied Physics & Engineering), 13(11):858-869.
[19] Hefny, A.M., Chua, H.C., Zhao, J., 2004. Parametric studies on the interaction between existing and new bored tunnels.
Tunnelling and Underground Space Technology, 19(4-5):471
[20] Hejazi, Y., Dias, D., Kastner, R., 2008. Impact of constitutive models on the numerical analysis of underground constructions.
Acta Geotechnica, 3(4):251-258.
[21] Hunt, D.V.L., 2005. Predicting the Ground Movements above Twin Tunnels Constructed in London Clay. PhD Thesis, University of Birmingham,Birmingham :
[22] ITASCA, 2009. FLAC Fast Lagrangian Analysis of Continua, Version 4.0. Itasca Consulting Group, Inc.,Minneapolis, USA :
[23] Jenck, O., Dias, D., 2004. Analyse tridimensionnelle en différences finies de l’interaction entre une structure en béton et le creusement d’un tunnel à faible profondeur.
Gotechnique, (in French),54(8):519-528.
[24] Karakus, M., Ozsan, A., Basarir, H., 2007. Finite element analysis for the twin metro tunnel constructed in Ankara Clay, Turkey.
Bulletin of Engineering Geology and the Environment, 66(1):71-79.
[25] Kasper, T., Meschke, G., 2004. A 3D finite element simulation model for TBM tunnelling in soft ground.
International Journal for Numerical and Analytical Methods in Geomechanics, 28(14):1441-1460.
[26] Kim, S.H., 1996.
Model Testing and Analysis of Interactions between Tunnels in Clay, PhD Thesis, University of Oxford,:
[27] Li, X., Du, S., Zhang, D., 2012. Numerical simulation of the interaction between two parallel shield tunnels.
, Proceeding of ICPTT: Better Pipeline Infrastructure for a Better Life, Wuhan, China, 1521-1533. :1521-1533.
[28] Liu, H.Y., Small, J.C., Carter, J.P., 2008. Full 3D modelling for effects of tunnelling on existing support systems in the Sydney region.
Tunnelling and Underground Space Technology, 23(4):399-420.
[29] Mahmutoğlu, Y., 2011. Surface subsidence induced by twin subway tunnelling in soft ground conditions in Istanbul.
Bulletin of Engineering Geology and the Environment, 70(1):115-131.
[30] Mollon, G., Dias, D., Soubra, A.H., 2013. Probabilistic analyses of tunnelling-induced ground movements.
Acta Geotechnica, 8(2):181-199.
[31] Ng, C.W.W., 2014. The state-of-the-art centrifuge modelling of geotechnical problems at HKUST.
Journal of Zhejiang University-SCIENCE A (Applied Physics & Engineering), 15(1):1-21.
[32] Ng, C.W.W., Lu, H., 2014. Effects of the construction sequence of twin tunnels at different depths on an existing pile.
Canadian Geotechnical Journal, 51(2):173-183.
[33] Ng, C.W.W., Lu, H., Peng, S.Y., 2013. Three-dimensional centrifuge modelling of the effects of twin tunnelling on an existing pile.
Tunnelling and Underground Space Technology, 35:189-199.
[34] Ocak, I., 2013. Interaction of longitudinal surface settlements for twin tunnels in shallow and soft soils: the case of Istanbul Metro.
Environmental Earth Sciences, 69(5):1673-1683.
[35] Suwansawat, S., Einstein, H.H., 2007. Describing settlement troughs over twin tunnels using a superposition technique.
Journal of Geotechnical and Geoenvironmental Engineering, 133(4):445-468.
[36] Wang, J.G., Kong, S.L., Leung, C.F., 2003. Twin tunnels-induced ground settlement in soft soil.
, Proceeding of the Sino-Japanese Symposium on Geotechnical Engineering, 241-244. :241-244.
[37] Yamaguchi, I., Yamazaki, I., Kiritani, Y., 1998. Study of ground-tunnel interactions of four shield tunnels driven in close proximity, in relation to design and construction of parallel shield tunnels.
Tunnelling and Underground Space Technology, 13(3):289-304.
[38] Yang, X.L., Wang, J.M., 2011. Ground movement prediction for tunnels using simplified procedure.
Tunnelling and Underground Space Technology, 26(3):462-471.
[39] Zhang, Z.G., Huang, M.S., 2014. Geotechnical influence on existing subway tunnels induced by multiline tunnelling in Shanghai soft soil.
Computers and Geotechnics, 56:121-132.
[40] Zheng, Y., Qiu, W., 2005. 3-D FEM Analysis of Closely Spaced Vertical Twin Tunnel. Underground Space Use: Analysis of the Past and Lessons for the Future. Taylor & Francis Group,London :1155-1160.
[41] Zhou, W.H., Chen, R.P., Zhao, L.S., 2012. A semi-analytical method for the analysis of pile-supported embankments.
Journal of Zhejiang University-SCIENCE A (Applied Physics & Engineering), 13(11):888-894.


Open peer comments: Debate/Discuss/Question/Opinion
<1>