Affiliation(s):
1.
Key Laboratory of Advanced Civil Engineering Materials of Ministry of Education, Tongji University, Shanghai 200092, China; moreAffiliation(s): 1.
Key Laboratory of Advanced Civil Engineering Materials of Ministry of Education, Tongji University, Shanghai 200092, China; 2.
Key Laboratory of Geotechnical and Underground Engineering of Ministry of Education, Tongji University, Shanghai 200092, China; less
Zheng-wu Jiang, Wen-ting Li, Zi-long Deng, Zhi-guo Yan. Experimental investigation of the factors affecting accuracy and resolution of the pore structure of cement-based materials by thermoporometry[J]. Journal of Zhejiang University Science A, 2013, 14(10): 720-730.
@article{title="Experimental investigation of the factors affecting accuracy and resolution of the pore structure of cement-based materials by thermoporometry", author="Zheng-wu Jiang, Wen-ting Li, Zi-long Deng, Zhi-guo Yan", journal="Journal of Zhejiang University Science A", volume="14", number="10", pages="720-730", year="2013", publisher="Zhejiang University Press & Springer", doi="10.1631/jzus.A1300101" }
%0 Journal Article %T Experimental investigation of the factors affecting accuracy and resolution of the pore structure of cement-based materials by thermoporometry %A Zheng-wu Jiang %A Wen-ting Li %A Zi-long Deng %A Zhi-guo Yan %J Journal of Zhejiang University SCIENCE A %V 14 %N 10 %P 720-730 %@ 1673-565X %D 2013 %I Zhejiang University Press & Springer %DOI 10.1631/jzus.A1300101
TY - JOUR T1 - Experimental investigation of the factors affecting accuracy and resolution of the pore structure of cement-based materials by thermoporometry A1 - Zheng-wu Jiang A1 - Wen-ting Li A1 - Zi-long Deng A1 - Zhi-guo Yan J0 - Journal of Zhejiang University Science A VL - 14 IS - 10 SP - 720 EP - 730 %@ 1673-565X Y1 - 2013 PB - Zhejiang University Press & Springer ER - DOI - 10.1631/jzus.A1300101
Abstract: thermoporometry (TPM) is a calorimetric-based technique for characterizing pore structure according to the freezing and melting point depression of liquid confined in pores which attributes to a varying phase-transition free energy by interface curvature. TPM has demonstrated an emerging success in applications for determining the mesopores of cement-based materials in recent decades. To improve its resolution and accuracy, this paper discussed these factors which show a great influence on the baseline heat flow and the derived pore structure using two molecular sieves with discontinuous size for calibration, referring to the sample handling, the mass of sample and the varying temperature. The pore size distributions of ordinary and high-strength concrete by TPM were favorably compared to the results taken by nitrogen adsorption/desorption (NAD) and mercury intrusion porosimetry (MIP). The results illustrated that both the accuracy and resolution improve with the decreasing cooling/heating rate until 1 °C/min; however, if the rate is too slow, it can lead to an unstable result. The mass of the sample tested has much less an effect on the accuracy when it increases to more than 30 mg. TPM is demonstrated to be more accurate to characterize the mesopores with the size bigger than 4 nm as compared to NAD and MIP.
Darkslateblue:Affiliate; Royal Blue:Author; Turquoise:Article
Article Content
1. Introduction
The durability of cement-based materials is dominated by its pore system, and also by the fluid-and-ion transport relating to the pore structure. These pores can be broadly classified into three categories: micropores (<2 nm), mesopores (2–50 nm) and macropores (>50 nm) according to size only (Landry, 2005). Capillary pores, which are usually identified with a wide size distribution spanning of the nanometric and mesometric, impact transport properties of cement-based materials significantly.
In available techniques used so far, the pore structure of cement-based materials has been characterized by nitrogen adsorption/desorption (NAD), mercury intrusion porosimetry (MIP), scanning electron microscopy (SEM), and thermoporometry (TPM). Based on certain prerequisites, all the methods have shown the ability to identify the characteristics of the pore structure (mainly pore volume and pore size distribution). As for the other properties, such as pore shape, tortuosity, and connectivity, these methods have provided insufficient information for an accurate interpretation. Moreover, a great limitation of these methods, including NAD, MIP, and SEM, is a potential for altering the pore structure by drying the sample during preparation, which may lead to a misunderstanding of the actual pore structure. Nuclear magnetic resonance (NMR) has been used as an alternative technique, recently be considered as there is no need to dry the samples prior; however, eventually there are still a lot of challenges to quantify the pore structures appropriately (Jehng et al., 1996; Mitchell et al., 2008).
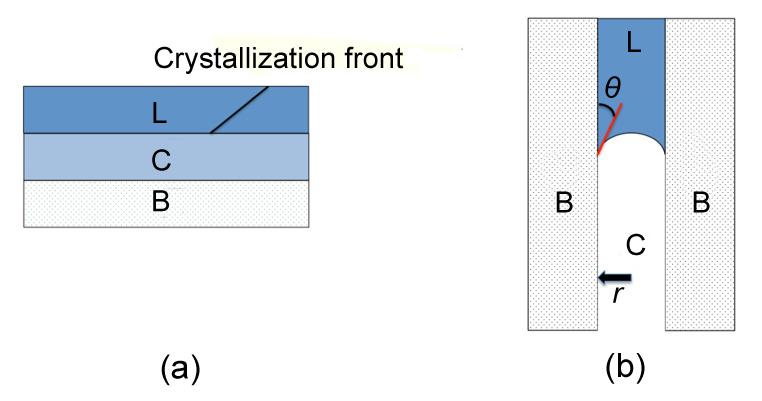
TPM is a calorimetric-based technique to characterize the pore structure of a material on thermodynamic principles. The pore structure can be determined according to the freezing and melting point depression of the condensed liquid in its pores (Brun et al., 1977; Landry, 2005; Sun and Scherer, 2010). The physical basis for this is that the equilibrium temperature of a solid-liquid transition can shift depending on the curvature of the interface between the solid and liquid phases (Landry, 2005) as shown in Fig. 1. The freezing and melting point of liquid, such as deionized water, is supposed to be 0 °C when no restraint is involved (Fig. 1a); however, this critical temperature can shift to a certain extent due to a new thermodynamic equilibrium at the curved interface (Fig. 1b). Heat exchange accompanying the transition of phases can thus be measured using a differential scanning calorimeter (DSC).
Fig.1 Schematic explanation of a solid-liquid transition in infinite space (a) and confined pore (b) B: boundary; L: liquid; C: crystal
The various characteristics of pore structure, such as pore volume, pore size distribution, pore shape, connectivity, etc., can be derived from a baseline heat flow of both freezing and melting of liquid in pores using a DSC. This baseline illustrates the rate of heat exchange of liquid melting or freezing transitions. An interface with a certain curvature is allowed for existence between the solid and liquid phases in a confined pore according to thermodynamic equilibrium. Thus, the curvature of the solid-liquid interface κcl is related to the depressed freezing point of liquid T according to the Gibbs-Thomoson equation (Defay and Prigogine, 1966; Scherer and Valenza, 2005; Sun and Scherer, 2010), which can be expressed as
,
where Sl and Sc are the molar entropies of the liquid and solid (crystalline) phases, respectively; γcl is the solid-liquid interface energy; Vl is the molar volume of the liquid, and TM(∞) is the melting temperature of a bulk crystal (i.e., with effectively infinite radius).
With the assumed pore shape, either cylindrical or spherical, the differential pore volume with respect to the pore radii can be calculated by (Brun et al., 1977; Hare and Sorensen, 1986; Fukusako, 1990; Ishikiriyama et al., 1995; Landry, 2005; Sun and Scherer, 2010)
,
where V is the accumulated pore volume; ΔT is the undercooling; Wth is the heat exchange measured by DSC; md is the weight of dry porous material; ρ is the density of either undercooling water or ice as a function of the undercooling, depending on the freezing or melting curve used for analysis and the pore space interest as suggested (Brun et al., 1977; Hare and Sorensen, 1986; Fukusako, 1990; Ishikiriyama et al., 1995; Landry, 2005; Sun and Scherer, 2010). The calculated result can be normalized by the mass of dry sample md to remove the effect of size.
More detailed calculations relating to the baseline can be found in previous studies (Brun et al., 1977; Landry, 2005; Sun and Scherer, 2010).
TPM has been successfully used to characterize various mesoporous solids with disordered structure, such as silica gel and porous glass, mostly during the last three decades (Ishikiriyama et al., 1995; Landry, 2005; Yamamoto et al., 2005). Recently, TPM has also been used to characterize the nanometric mesopore structure of cement-based materials (Kim et al., 1994; Scherer, 1999; Hay and Laity, 2000; Sun and Scherer, 2010; Sant et al., 2011) since capillary pores play a significant role in liquid transport. Importantly, TPM is particularly effective in detecting crystallization in the pores with radii size between 4 and 100 nm which has been considered as a main contribution to frost damage of concrete (Scherer, 1999; Sun and Scherer, 2010).
However, the accuracy and resolution of TPM in the characterization of porous cement-based materials has not been adequately assessed. Many factors have shown a significant influence on the accuracy and resolution of the measured results because of a more complicated pore system of cement-based materials compared to that of the other homogeneous matrix, such as metal, glass, etc. Thus, the present work especially investigates these potential factors, including the specimen handling, the features of the specimens and the varying temperatures that needed to provide a better understanding of the interpretation as well as the reproducibility of TPM measurement.
2. Experimental
2.1. Mixture proportions and raw materials
P·II52.5 Portland cement was used for the cement paste and concrete throughout. The water to cement (w/c) ratio is 0.6 for hardened cement paste (HCP). The crushed aggregates and natural river sand were used for two series of concrete, which are labeled as PC for normal concrete and HC for high strength concrete, differentiated by w/c ratio. The detailed mixture proportions are listed in Table 1.
Table 1
Mixture proportions
Type of concrete
Strength grade
w/c
Cementitious materials (kg/m3)
Water (kg/m3)
Manufactured sand (kg/m3)
Gravel (kg/m3)
Fly ash (%)
Water reducing agent (%)
PC
C30
0.45
370
170
936
974
30
0.60
HC
C55
0.33
500
165
881
954
0
1.12
Two molecular sieves namely, MCM-41 and sba-15 with the most probable pore sizes of 3 nm and 8 nm, respectively, were used for calibration.
2.2. Preparation of specimens
The specimens were prepared as cubes with dimensions of 10 cm×10 cm×10 cm. Mixing was performed in accordance with the standards GB/T 50081-2002. The specimens were cured in water for one year.
2.3. Test procedure
The specimens were smashed to small pieces before testing. One piece was picked out and dried for 6 h at 70 °C. After that, the sample was immersed in deionized (DI) water and vacuum saturated to remove the air inside. The saturated sample was then placed into a crucible and a droplet of kerosene was added on its surface. The crucible system was sealed and delivered into the test-bed of DSC for testing.
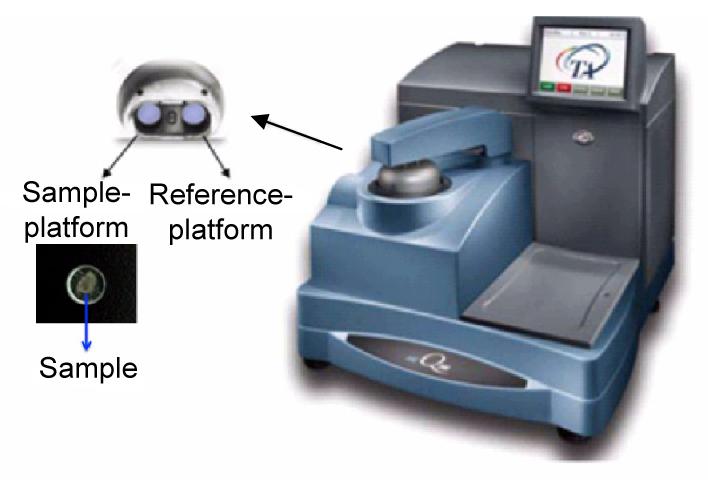
A DSC Q100 produced by Thermal Analysis & Analyzers Instrument (TA) was used in this study as shown in Fig. 2.
Fig.2 Experimental setup: DSC Q100 and sample
3. Results and discussion
3.1. Factors influencing accuracy
3.1.1. Specimen handling
1. Sealability
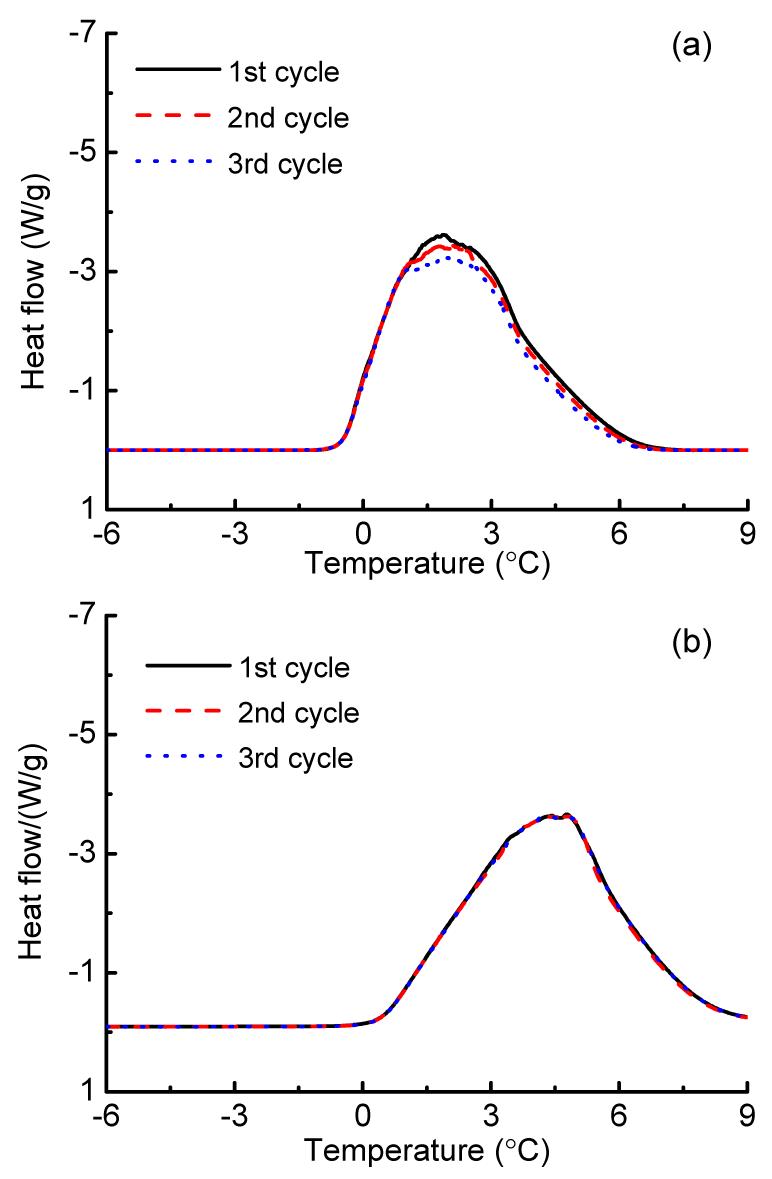
The influence of sealability of the testing system was examined by repeated testing of three cycles with DI water at temperatures of −30–10 °C at a given heating rate of 3 °C/min. The heat flow variation of DI water with the temperature is shown in Fig. 3 for both the unsealed and sealed systems. The peak heat decreases with the time elapsed due to a fast evaporation of water driven by gradient pressure between nitrogen around and water vapor for the unsealed samples as shown in Fig. 3a. Fig. 3b shows a reproductive heat flow for all three cycles when the test setup is well sealed. Therefore, it is necessary to ensure that the system is well sealed during testing to prevent any heat exchange between the liquid and environment.
Fig.3 Heat flow of DI water with temperature: (a) unsealed; (b) sealed
2. Heat conductive media
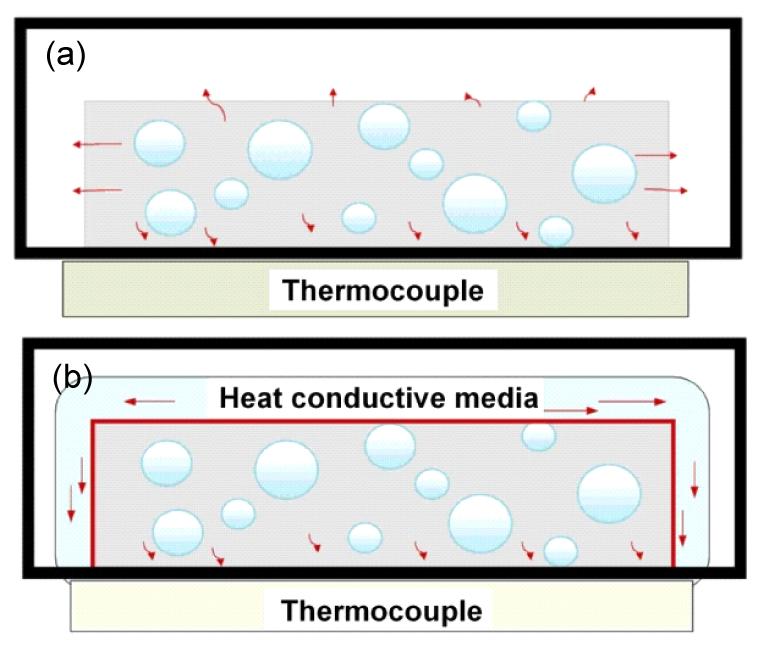
The heat exchange is normally sensed by a thermocouple placed in the aluminum pan on which the sample is stored as shown in Fig. 4a. This may lead to missing heat from the side surfaces being recorded. Thus, to improve the thermal contact between the sample and the aluminum pan, a droplet of kerosene was added on the top of the sample as a heat conductive media to minimize drying of the sample during cooling and heating as shown in Fig. 4b. The thermal stability of kerosene was also examined prior, as shown in Fig. 5, where the heat flow of kerosene is kept stable in the range of −60–10 °C.
Fig.4 Schemetic illustration using kerosene as a heat conductive media to minimize drying of the sample during cooling and heating: (a) without heat conductive covered; (b) with heat conductive covered
Fig.5 Heat flow of kerosene at a heating/cooling rate of 3 °C/min
Fig. 6 shows the heat flow of the DI water with and without kerosene added in a sealed system. The results for the three cycles are similar; however, the peak heat increases 1 W/g approximately when kerosene was added due to a more effective sensing and a better conductivity.
Fig.6 Heat flow of DI water: (a) sealed and no kerosene covered; (b) sealed and kerosene covered
3.1.2. Specimen mass
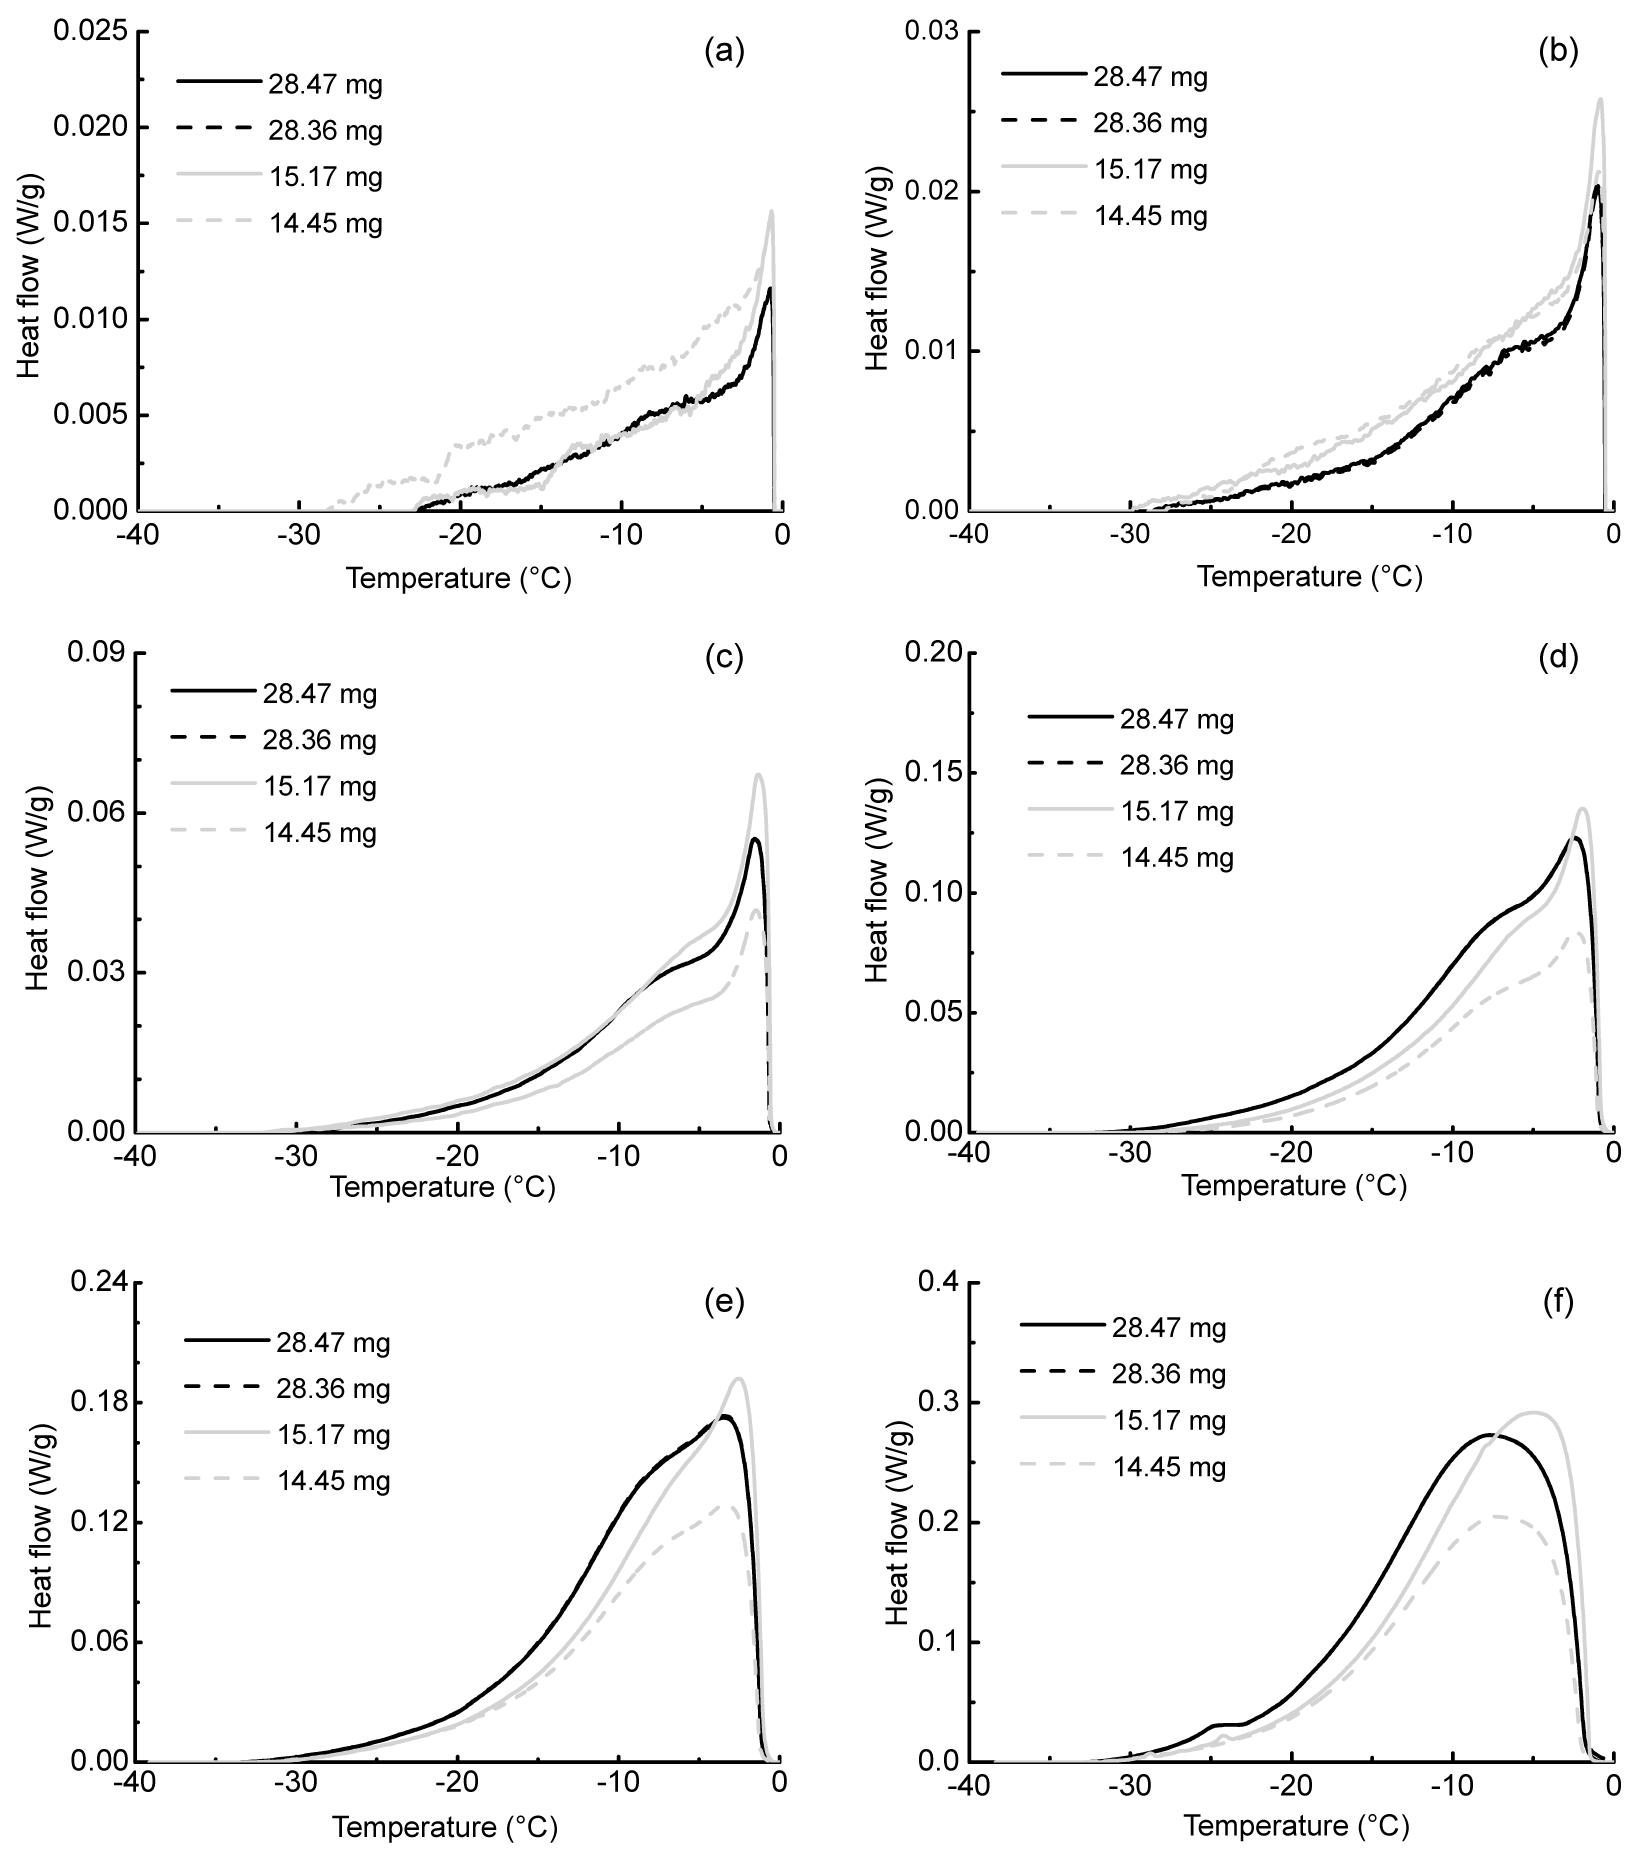
Fig. 7 shows the influence of the mass of the sample on the heat flow at different cooling rates of 0.15 °C/min, 0.3 °C/min, 1 °C/min, 3 °C/min, 5 °C/min, and 10 °C/min for HCP. Note that the heat flow in W/g shown on the y axis has already been normalized by its dry mass to remove the influence of its size. The partial heat with respect to temperature above −0.46 °C should not be included because the heat is from the melting of water frozen on the surface of the sample instead of the solid-liquid transition in the confined pores as demonstrated in the following case.
Fig.7 Influence of mass of HCP on heat flow at different cooling rates of 0.15 °C/min (a), 0.3 °C/min (b), 1 °C/min (c), 3 °C/min (d), 5 °C/min (e), and 10 °C/min (f)
The decreasing heat released with the temperature at −30 °C implies that the smaller the pores are, the less proportion they account for in the total pore volume. This is because the freezing and melting of the liquid confined in smaller pores, which is with a bigger curvature at the interface, occurs at a lower temperature according to the thermodynamic equilibrium. The mass of the sample shows a great influence on the heat profile when the mass increases from 14.45 mg to 15.17 mg; however, when the mass increases further beyond 28 mg, the heat flow curve does not show that much change. Furthermore, the heat flow curves become smoother with the increasing cooling rate compared to a fluctuating profile at a lower rate. Crystallization of the amount of liquid in pores is a time-consuming process which can generally be divided into the formation of cores and growth of crystals, and thus a too fast cooling rate may not allow the pores to finish crystallization at a supposed temperature before it further decreases. In addition, athermal lag can easily be generated in a bigger sample when a higher cooling rate is applied because the normal cement-based materials are with poor heat conductivity, which delays crystallization of the liquid accordingly. Note that crystallization of liquid initiates the pores with a bigger size, and the freezing front penetrates gradually towards the smaller pores with the decreasing temperature. More heat exchange generates accompanying freezing of liquids at a faster cooling rate. Therefore, the influence of mass at a given cooling rate on heat is a combined effect of the three factors mentioned above.
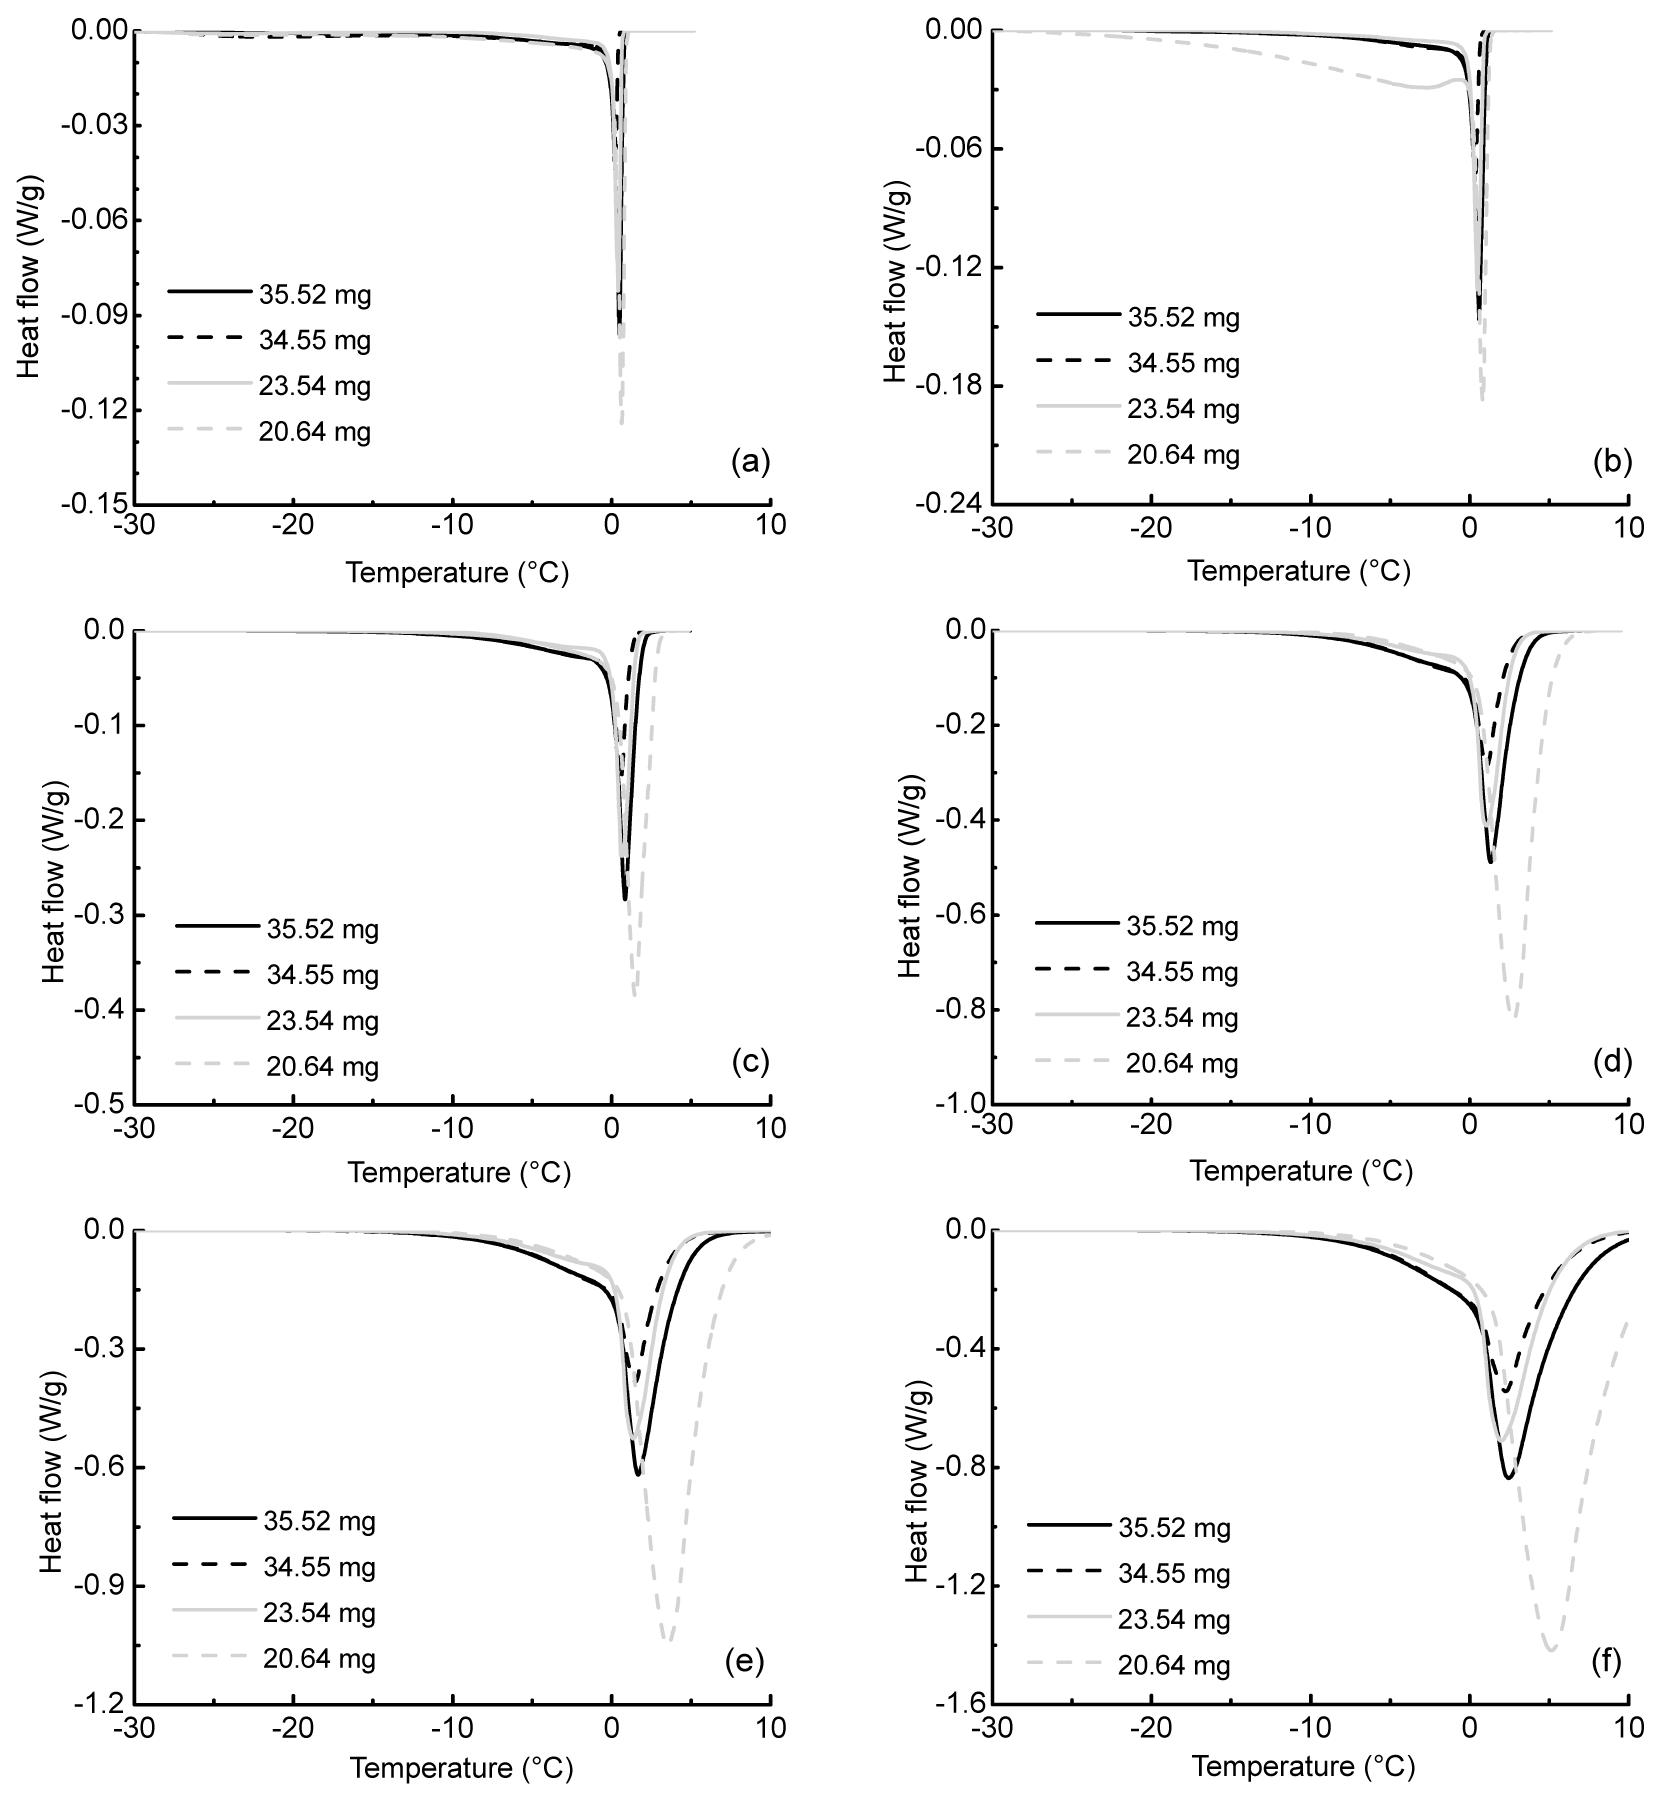
Fig. 8 shows the influences of mass at different rates of heating. Similarly, only the partial heat below the temperature of −0.46 °C is supposed to be related to the events of freezing and melting that occur in the confined pores.
Fig.8 Influence of mass of HCP on heat flow at different heating rates of 0.15 °C/min (a), 0.3 °C/min (b), 1 °C/min (c), 3 °C/min (d), 5 °C /min (e), and 10 °C/min (f)
The heat absorbed by the sample increases with temperature as the ice starts to melt. Similar to the cooling process, this demonstrates a greater proportion of the pores with bigger size than that of the smaller pores as explained aforementioned. The exchange heat does not show a monotonically increasing or decreasing with the mass of the sample. When the heating rate is no more than 1 °C/min, the heat profiles are very similar to each other for all of the mass except that of the sample with a mass of 20.64 mg, which exhibits a much lower profile at a heating rate of 0.3 °C/min. More attention is needed to explain this phenomenon. When the heating rate increases beyond 1 °C/min, a noticeable increase of the heat can be observed when the sample grows from 23.54 mg to 34.55 mg. Thus, a sample of more than 30 mg is recommended in the present testing.
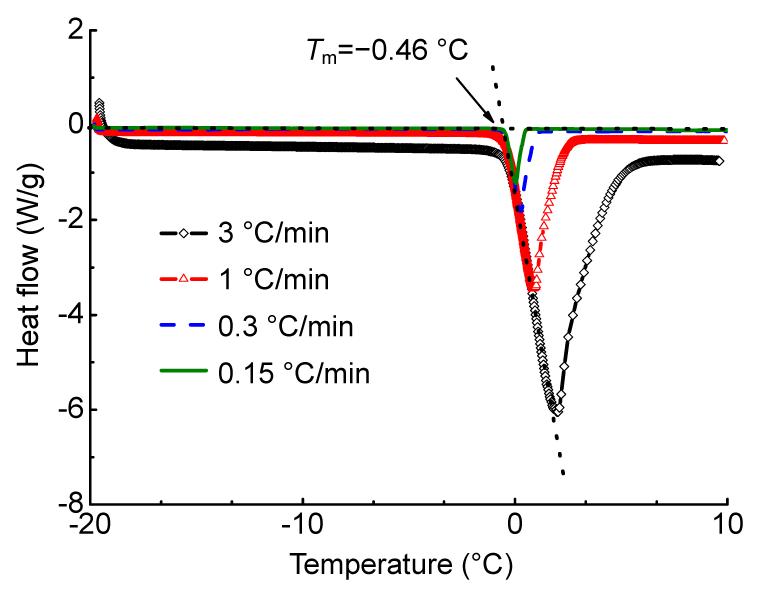
Fig. 9 shows the melting point of DI water at different heating rates of 3 °C/min, 1 °C/min, 0.3 °C/min, and 0.15 °C/min, respectively. This melting point is determined to be −0.46 °C approximately using the intersection point between the slope line of the heat curves and the horizontal line that presents the initiation of ice melting, considering that not all the ions have been removed from the DI water. That partial heat above this point of −0.46 °C is thus supposed to be a result of the melting of water frozen on the surface of the sample instead of the melting of ice in the confined pores.
Fig.9 Melting point of DI water deterimined from heat flow at different heating rates
3.1.3. Temperature variation
1. Cooling rate
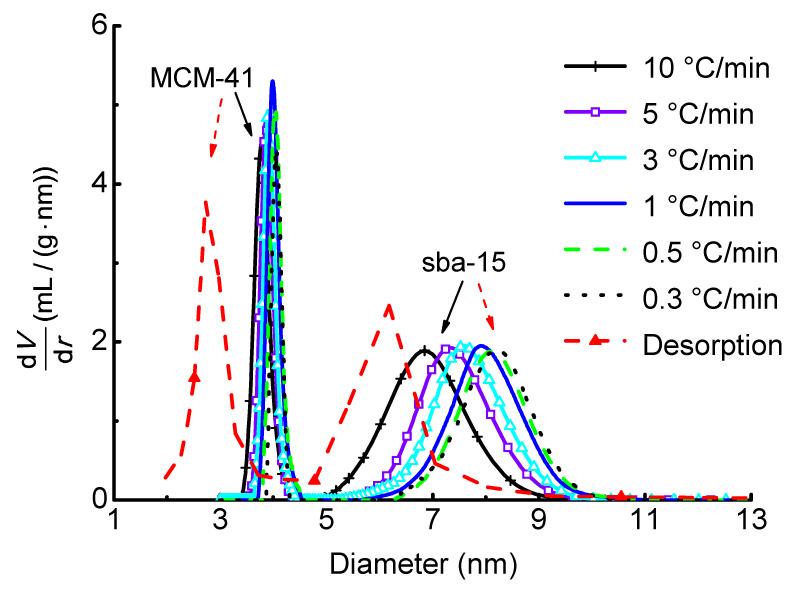
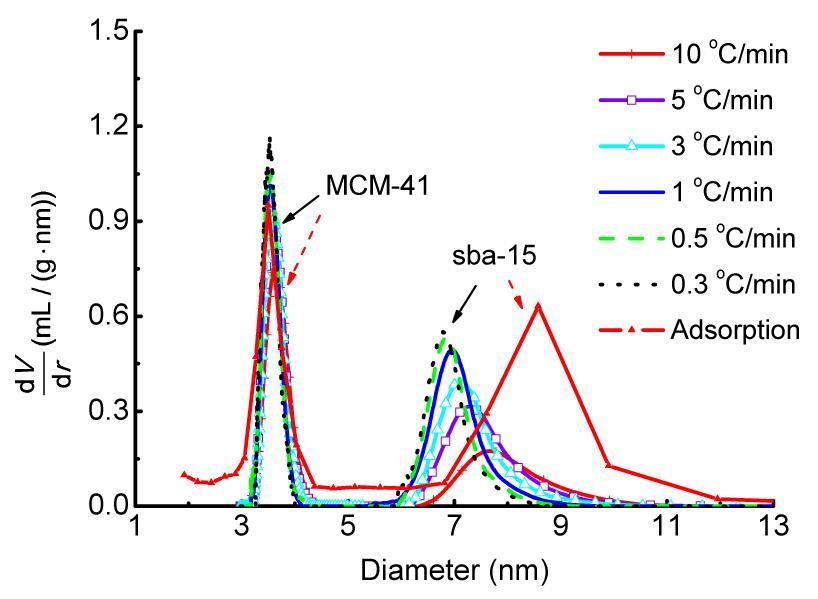
Fig. 10 illustrates the influence of the cooling rate on the pore size distribution using two molecular sieves namely, MCM-41 and sba-15 by TPM and NAD to calibrate. Apparently, the pore size measured by NAD is 1–2 nm shifted to the left of that by TPM. The TPM distribution shifts slightly toward right on the scale of the diameter with the decreasing cooling rate, but the amount of shift decreases relative to each other till the distribution curves almost coincide with the cooling rates of 0.5 °C/min and 0.3 °C/min. In addition, the peak, which corresponds to the most probable pore size, is converging to 8 nm for sba-15 as its actual value. This implies that the cooling rate does not affect the measured pore size very greatly with the decreasing cooling rate. A too fast cooling rate may lead to undercooling, causing non-synchronous frozen ice because of the gradient temperature and the overlapping heat peak due to a lower resolution as demonstrated below.
Fig.10 Pore size distribution of two molecular sieves at different cooling rates by TPM and NAD
It can also be found that the NAD distribution, which shows a most probable pore of 6 nm in diameter, does not agree with 8 nm by TPM. Moreover, the influence of the cooling rate on the pore size distribution of MCM-41 is not as much as that of sba-15 as seen from that of the peak which appears at 4 nm with TPM for all the rates except that of 10 °C/min, where a comparatively greater shift occurs. However, the most probable pore size was determined to be 3 nm for MCM-41 in prior tests, which is consistent with that determined by NAD. Therefore, TPM shows a more accurate characterization of pore size of >4 nm in terms of diameter as compared to NAD.
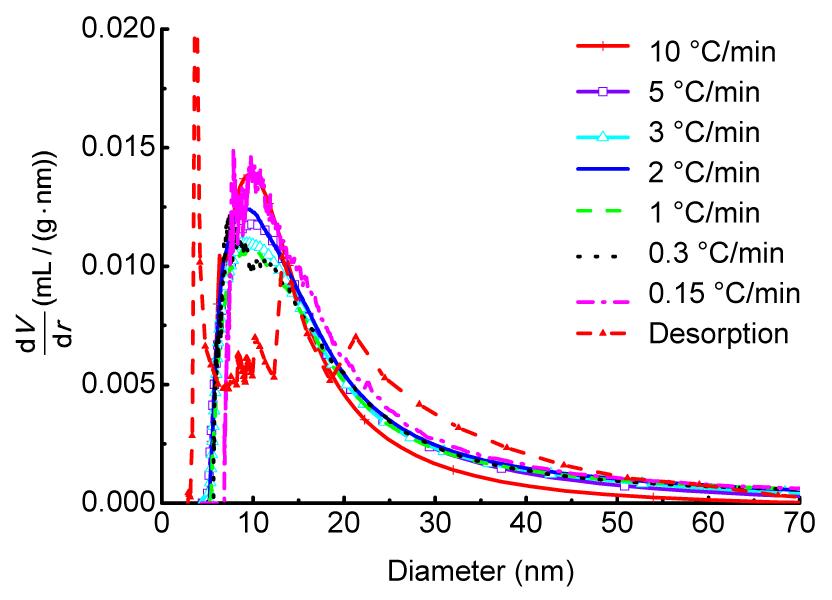
The influence of the cooling rate was also examined on the cement paste as shown in Fig. 11. Generally, the pore size distribution by TPM is well reproduced particularly when the cooling rate decreases below 1 °C/min except a few fluctuations appear at 10–15 nm for the cooling rate of 0.15 °C/min due to a limited resolution of DSC equipment used in this study. Another potential reason is a more complicated pore system and material structure of cement paste, which are not filled with perfect spherical pores as the two molecular sieves for calibration but rather a tortuous, connected and topological network of pores. This also explains the reason for the absence of the fluctuations for the two molecular sieves. The desorption distribution from NAD shows a bigger proportion of the pores with the size less than 5 nm, since NAD was validated to be more accurate and sensitive to the pores in a smaller range of <4 nm previously. Moreover, the proportion of pores bigger than 20 nm by NAD is higher than that by TPM, which can be attributed to crush or deformation of pores as a result of vacuum drying during sample preparation.
Fig.11 Pore size distribution of cement paste at different cooling rates by TPM and NAD
2. Heating rate
Fig. 12 shows the pore size distribution of MCM-41 and sba-15 at different heating rates by TPM and NAD. It can be obviously seen that the distribution by adsorption agrees well with that by TPM in the most probable pore size of 3–4 nm for MCM-41. The heating rate exhibits a great influence on the maximum differential pore volume of the smaller pores (<5 nm). For the larger scale (>5 nm), the TPM distribution shifts gradually to the left with the decreasing heating rate until 1 °C/min, which is not observed for MCM-41, and the peak value of increases simultaneously. The NAD distribution of sba-15 shows a quite different most probable pore size of 9 nm compared to 7 nm by TPM, which is consistent with the results of cooling.
Fig.12 Pore size distribution of two molecular sieves at different heating rates by TPM and NAD
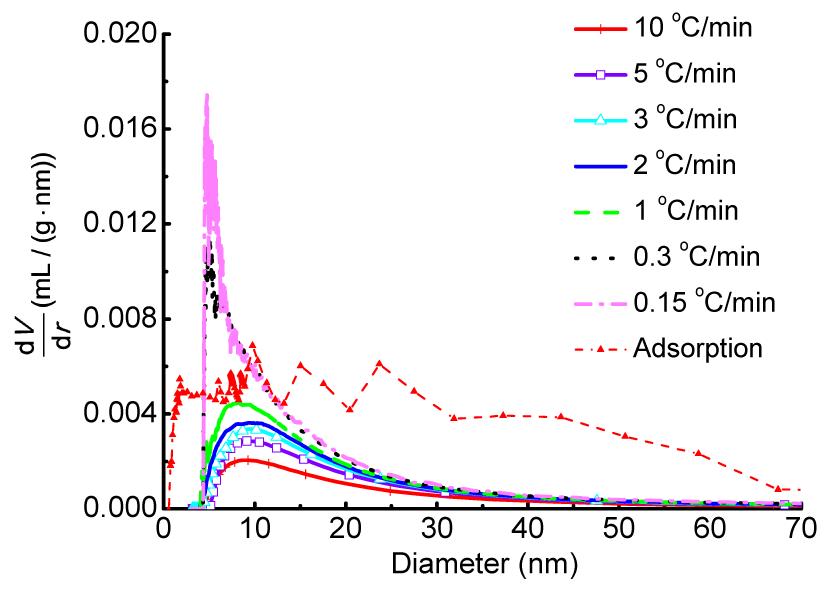
The heating rate has also shown an influence on the pore characterization of cement paste by TPM as illustrated in Fig. 13. NAD exhibits a wider pore size span of 1–70 nm whereas the TPM distribution is mainly located in the range of <30 nm. Again, the bigger pores detected by NAD can be explained as a result of vacuum drying of the samples during preparation. The distribution curve shifts with the heating rate as well as the maximum differential pore volume until an intensive rise of this peak value from 0.004 at 1 °C/min to 0.016 at 0.0.3 °C/min of heating occurs, both of which are close to the limits of accuracy and resolution of the DSC equipment.
Fig.13 Pore size distribution of cement paste at different heating rates by TPM and NAD
Moreover, the cooling rate shows less impact on the pore size distribution than that of the heating rate by comparing Fig. 11 and Fig. 13. It is worthwhile to note that too slow a rate of cooling/heating may lead to unstable results for cement paste because of its complicated pore system and material structure as well as its limited resolution. Therefore, the cooling rate of 1 °C/min is favorable for accuracy according to the present results.
3.2. Factors influencing resolution
3.2.1. Cooling rate
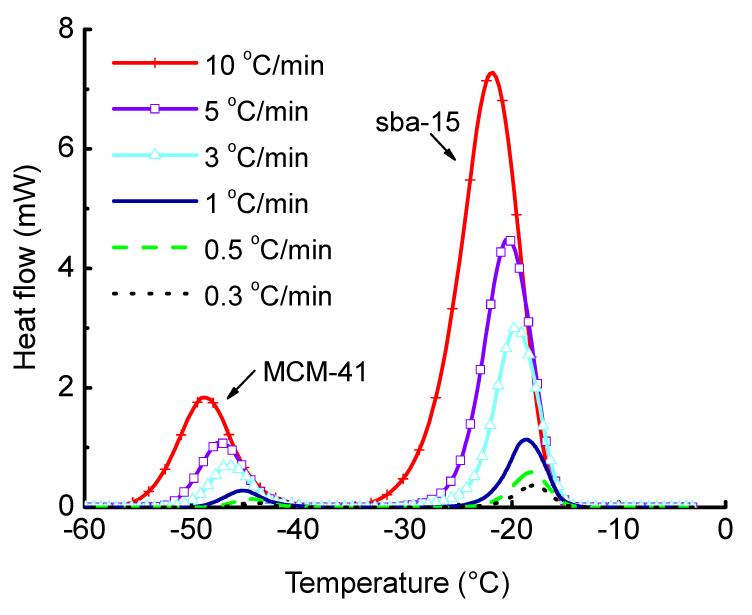
Fig. 14 shows the influence of the cooling rate on the baseline heat flow of two molecular sieves, i.e., MCM-41 and sba-15 by TPM and NAD. The resolution degrades with the decreasing cooling rate as the difference between the two heat peaks becomes smaller when the rate decreases to 1 °C/min as well as the heat profile.
Fig.14 Heat flow of MCM-41 and sba-15 at different cooling rates
3.2.2. Heating rate
Fig. 15 shows the baseline heat flow of MCM-41 and sba-15 at different heating rates by TPM and NAD. Similarly, the resolution degrades with the decreasing heating rates until the rate drops to 1 °C/min.
Fig.15 Heat flow of MCM-41 and sba-15 at different heating rates
In addition, the area under the heat curve, which represents the total heat exchange between the sample and the environment, is shown to decrease with the rate of temperature variation as well as the heat peak until 1 °C/min when a minor shift of the profile is observed for a further increase of the rate. This can be attributed to a more overlapped heat occuring due to a too fast cooling rate because of a degraded resolution, undercooling of water which is supposed to be time-consuming to finish its transition, and non-synchronous freezing of ice because of the gradient temperature in the sample. Thus, the rate of 1 °C/min is recommended and used in the subsequent study.
4. Application of TPM in concrete
4.1. Stability of cement paste during testing
Fig. 16 shows the heat stability of cement paste in heating and cooling. The chemical-bounded water molecule has been reported to incur a loss at temperatures above 80 °C (Klemm and Klemm, 1997). Therefore, the sample used here was firstly dried at 70 °C for 6 h to get rid of the capillary water and absorbed water without any damage or interference to the material struture. With a temperature of −70–10 °C, the dried cement paste exhibits a good thermal stability and no heat exchange from phase transition of the chemical-bounded water molecules were observed.
Fig.16 Heat flow of cement paste at heating/cooling rate of 3 °C/min
4.2. Pore structure of concrete by TPM
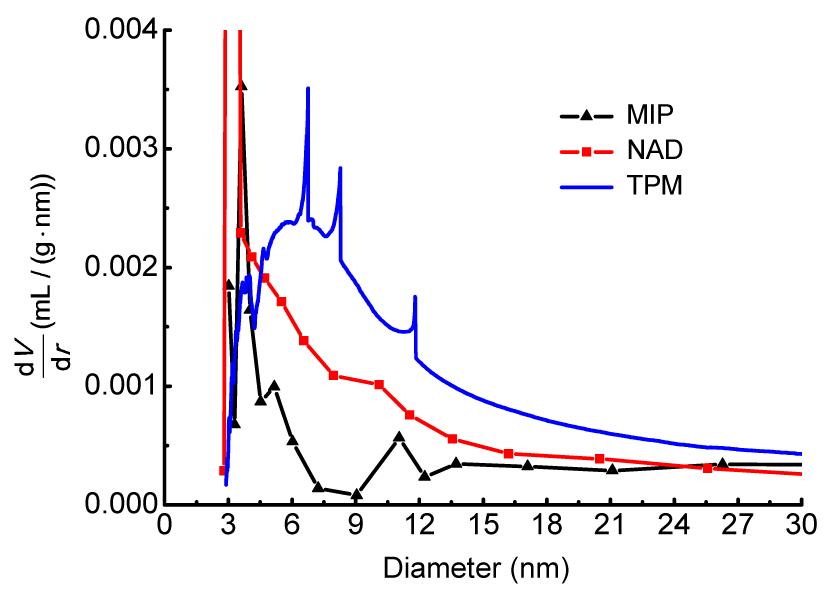
Fig. 17 compares the pore size distribution of PC measured by different techniques, referring to MIP, NAD, and TPM. A great difference can be observed as the differential pore volumes obtained by MIP and NAD exhibit a sharper distribution on the scale of pore size compared to that by TPM. The pores with diameters less than 4 nm account for a high proportion in the total volume of pores as measured by MIP and NAD, whereas the distribution determined by TPM shifts to a bigger scale with a peak appearing approximately between 4–9 nm. This may attribute to the underlying principle of these methods to interpret the pore structure as explained in previous studies (Landry, 2005; Sun and Scherer, 2010), which can be a result of the big pores that nitrogen is accessible to depending on the pressure applied in NAD and the partial space occupied by the liquid already in the pores will not be included in the total volume of pores for the MIP measurement. Thus, TPM shows a comparatively accurate characterization of nanometric pore size distribution in this perspective though a potential layer of unfrozen water between the ice and the pore wall will have an effect on the baseline heat flow and can be corrected (Sun and Scherer, 2010). Moreover, the smallest pore radius that nitrogen is accessible to is about 3 nm corresponding to that entered by ice at −40 °C.
Fig.17 Pore size distribution of PC by MIP, NAD, and TPM
Fig. 18 shows the pore size distribution by MIP, NAD, and TPM. It is not surprising to see that the pores distribute mostly in a range of small radii of <6 nm because of a low w/c ratio and more cementitious components. However, the pore that mercury is able to enter initiates 4 nm due to a higher pressure required by intruding mercury into small pores and that may lead to a crush or deformation of pores. The distribution curves by NAD and TPM agree well for HC specimens as expected since the pore system is refined.
Fig.18 Pore size distribution of HC by MIP, NAD, and TPM
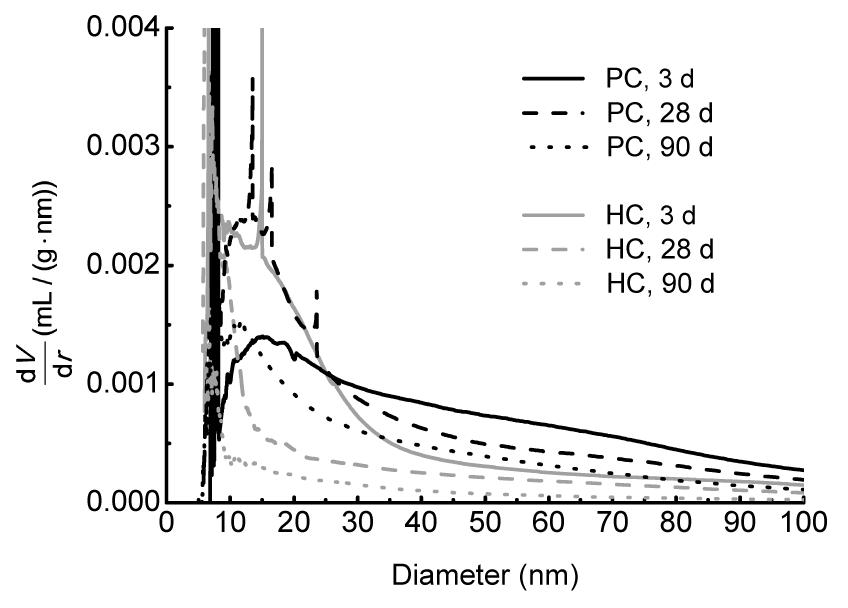
Fig. 19 compares the pore size distribution of PC and HC measured by TPM at the interval ages of 3 d, 28 d, and 90 d. The pores shift to the smaller radii with curing time since pores are refined due to the ongoing hydration of cementitious components. The peak appears in a shared range of 10–25 nm in radii for both PC and HC at 3 d when the cementitious systems are still premature. However, a higher proportion of pores bigger than 25 nm of PC is observed compared to that of HC at the same age because of a lower w/c ratio and more cementitious additives. It is worthwhile to note that pores can affect the properties of concrete materials depending on their size, connectivity, tortuosity, etc. (Landry, 2005). The nanometric mesopores in <50 nm are normally considered as having few negative effects on concrete, which accounts for a high ratio for HC. In contrast, PC still shows a certain amount of pores of >50 nm at 3 d and these pores decrease gradually with further hydration of the cement by a longer curing.
Fig.19 Pore size distribution of PC and HC by TPM at different ages
5. Conclusions
The factors which have a greater influence on the accuracy and resolution of TPM in applications for characterizing the pore structure of cement-based materials were examined in this study. Two inert molecular sieves with discontinuous size distribution were used for calibration. The pore characteristics of ordinary and high strength concrete measured by TPM were favorably compared to that by MIP and NAD in the same fashion. The conclusions can be drawn as follows.
The accuracy improves with the decreasing cooling/heating rate as well as the resolution. The cooling rate shows less impact on the measured pore size distribution than that of heating. A greater influence was observed for the molecular sieve with a bigger size. The pore size distribution becomes less affected by a slower rate of temperature variation until 1 °C/min; however, too slow a rate of cooling/heating can lead to unstable results for cement paste. The resolution decreases with the cooling rate and becomes stable when the cooling rate is not beyond 1 °C/min.
The mass of the sample used shows a greater influence on the accuracy of the pore distribution curve. The sample of more than 30 mg exhibits a more reproductive profile. However, a smaller sample is more favorable to maximize its sensitivity to thermal effects; thus, a mass of more than 30 mg is recommended.
The dried cement paste exhibits a good thermal stablility and no heat from chemical-bounded water molecule frozen in fine pores were observed.
TPM shows a comparatively accurate characterization on nanometric pores in this perspective of >4 nm whereas NAD is validated to be more accurate and sensitive to the pores in a smaller range of <4 nm and >20 nm. The distribution curves for NAD and TPM agree well for HC mostly in a range of <6 nm in radii because of a refined pore system for a low w/c ratio and further hydration of cementitious additives.
[1] Brun, M., Lallemand, A., Quinson, J.F., Eyraud, C., 1977. A new method for the simultaneous determination of the size and the shape of pores: the thermoporometry. Thermochimica Acta, 21(1):59-88.
[2] Defay, R., Prigogine, I., 1966. Surface Tension and Adsorption. Wiley,New York :
[3] GB/T 50081-2002, . Standard for Test Method of Mechanical Properties on Ordinary Concrete. (in Chinese), Ministry of Construction,,China :
[4] Hare, D.E., Sorensen, C.M., 1986. Densities of supercooled H2O and D2O in 25 u glass capillaries. Journal of Chemical Physics, 84(9):5085-5089.
[5] Hay, J.N., Laity, P.R., 2000. Observations of water migration during thermoporometry studies of cellulose films. Polymer, 41(6):6171-6180.
[6] Fukusako, S., 1990. Thermophysical properties of ice, snow, and sea ice. International Journal of Thermophysics, 11(2):353-372.
[7] Ishikiriyama, K., Todoki, M., Motomusa, K., 1995. Pore size distribution (PSD) measurements of silica gels by means of differential scanning calorimetry: I. Optimization for determination of PSD. Journal of Colloid and Interface Science, 171(1):92-102.
[8] Jehng, J.Y., Sprague, D.T., Halperin, W.P., 1996. Pore structure of hydrating cement paste by magnetic resonance relaxation analysis and freezing. Magnetic Resonance Imaging, 14(7-8):785-791.
[9] Kim, K.J., Fane, A.G., Aim, R.B., Liu, M.G., Jonsson, G., Tessaro, I.C., Broek, A.P., Bargeman, D., 1994. A comparative study of techniques used for porous membranes characterization-pore characterization. Journal of Membrane Science, 87(1-2):35-46.
[10] Klemm, A.J., Klemm, P., 1997. Ice formation in pores in polymer modified concrete-II: the influence of the admixtures on the water to ice transition in cement-based composites subjected to freezing/thawing cycles. Building and Environment, 32:199-202.
[11] Landry, M.R., 2005. Thermoporometry by differential scanning calorimetry: experimental considerations and applications. Thermochimica Acta, 433(1-2):27-50.
[12] Mitchell, J., Beau, J., Webber, W., Strange, J.H., 2008. Nuclear magnetic resonance cryoporometry. Physics Reports, 461:1-36.
[13] Sant, G., Bentz, D., Weiss, J., 2011. Capillary porosity depercolation in cement-based materials: measurement techniques and factors which influence their interpretation. Cement and Concrete Research, 41(8):854-864.
[14] Scherer, G.W., 1999. Crystallization in pores. Cement and Concrete Research, 29(8):1347-1358.
[15] Scherer, G.W., Valenza, J.J., 2005. Mechanisms of Frost Damage, Materials Science of Concrete, American Ceramic Society,:209-246.
[16] Sun, Z.H., Scherer, G.W., 2010. Pore size and shape in mortar by thermoporometry. Cement and Concrete Research, 40(5):740-751.
[17] Yamamoto, T., Endo, A., Inagi, Y., Ohmori, T., Nakaiwa, M., 2005. Evaluation of thermoporometry for characterization of mesoporous materials. Journal of Colloid and Interface Science, 284(2):614-620.
Open peer comments: Debate/Discuss/Question/Opinion


Open peer comments: Debate/Discuss/Question/Opinion
<1>