Affiliation(s):
1.
Department of Road and Railway Engineering, School of Civil Engineering, Beijing Jiaotong University, Beijing 100044, China; moreAffiliation(s): 1.
Department of Road and Railway Engineering, School of Civil Engineering, Beijing Jiaotong University, Beijing 100044, China; 2.
Patent Examination Cooperation Center of the Patent Office, State Intellectual Property Office of the Peoples Republic of China, Beijing 100083, China; less
Jin Shi, Wen-shan Fang, Ying-jie Wang, Yang Zhao. Measurements and analysis of track irregularities on high speed maglev lines[J]. Journal of Zhejiang University Science A, 2014, 15(6): 385-394.
@article{title="Measurements and analysis of track irregularities on high speed maglev lines", author="Jin Shi, Wen-shan Fang, Ying-jie Wang, Yang Zhao", journal="Journal of Zhejiang University Science A", volume="15", number="6", pages="385-394", year="2014", publisher="Zhejiang University Press & Springer", doi="10.1631/jzus.A1300163" }
%0 Journal Article %T Measurements and analysis of track irregularities on high speed maglev lines %A Jin Shi %A Wen-shan Fang %A Ying-jie Wang %A Yang Zhao %J Journal of Zhejiang University SCIENCE A %V 15 %N 6 %P 385-394 %@ 1673-565X %D 2014 %I Zhejiang University Press & Springer %DOI 10.1631/jzus.A1300163
TY - JOUR T1 - Measurements and analysis of track irregularities on high speed maglev lines A1 - Jin Shi A1 - Wen-shan Fang A1 - Ying-jie Wang A1 - Yang Zhao J0 - Journal of Zhejiang University Science A VL - 15 IS - 6 SP - 385 EP - 394 %@ 1673-565X Y1 - 2014 PB - Zhejiang University Press & Springer ER - DOI - 10.1631/jzus.A1300163
Abstract: Track irregularities have an obvious effect on the running stability and ride quality of maglev trains traveling at high speeds. We developed a measurement principle and data processing method which were applied to the high speed maglev line operating. The method, which includes partial filtering, integration, resampling of signal, and a low pass Butterworth filter, was used to calculate the irregularities of the maglev line. The spectra of the sample space were evaluated. A 7-parameter power spectrum density (PSD) function of line irregularities was fitted, based on the measured data. Analysis of the results showed that the maglev stator plane irregularities were better than conventional railway vertical rail irregularities when the wavelength was 5–100 m, and worse when the wavelength was 1–5 m. The PSD of maglev guidance plane irregularities was similar to that of cross level GRSHL (German railway spectra of high irregularity) when the wavelength was 10–100 m. The irregularities were clearly worse than cross level rail irregularities in a conventional railway when the wavelength was 1–10 m. This suggests that short-wavelength track irregularities of a maglev line caused by deviation and inclination of the stator plane should be minimized by strictly controlling the machining error of functional components during construction and maintenance.
Darkslateblue:Affiliate; Royal Blue:Author; Turquoise:Article
Article Content
1. Introduction
The maglev system has the advantages of less environmental impact and better ride quality than a conventional rail system. Research and development in maglev technology are being actively pursued in Europe, Japan, and the USA. The Shanghai maglev system, which adopted Transrapid 08 (TR08) technology, was the first commercial high speed maglev system (Fig. 1). This line, which links Pudong International Airport with Long Yang Road Station, is about 30 km long, and the journey takes just 7 min to complete. The peak speed is 431 km/h and the average speed 266 km/h. All adjustment and test work has been conducted successfully without any safety or operational problems.
Track irregularities have important effects on the stability and ride quality of maglev trains. In the past two decades, numerous researchers have focused their efforts on this problem. The power spectrum density (PSD) function of track irregularities of a permanent maglev line (Tsunashima and Abe, 1998) has been studied by some researchers (Kwon et al., 2008; Zhao and Zhai, 2008). A vertical profile of maglev line irregularities was simulated by PSD functions of a conventional railway track (Yau, 2009; 2010). The actual track irregularities of a maglev system were applied in Korea to investigate the dynamic responses of an urban transit maglev vehicle and guideway (Lee et al., 2009). The PSD function of track irregularities of the Tangshan low speed maglev line in China was estimated by means of a sample stationary test (Zhou et al., 2012). An inertial measurement method for detecting long wave irregularity of a maglev guideway was introduced, and a linear phase IIR variable filter was designed to extract the long wave components from the measured signals (Zheng et al., 2007). An integrated measurement system was described (Nieters, 2004), which used the vehicle’s own sensors to monitor the position of the statorpacks and guidance rails for the Shanghai maglev line. However, little research has been conducted on analyzing the irregularity of a high speed maglev line, and no detailed method has been proposed to characterize the irregularities, especially for the high speed maglev (TR08) line.
In this paper, a method for measurement and processing of irregularities of the high speed maglev line is described. By using our processing method, the irregularities are calculated by air gap and magnet displacement. The characteristics and distribution of track irregularities in space wavelengths are analyzed.
2. Cause of track irregularities
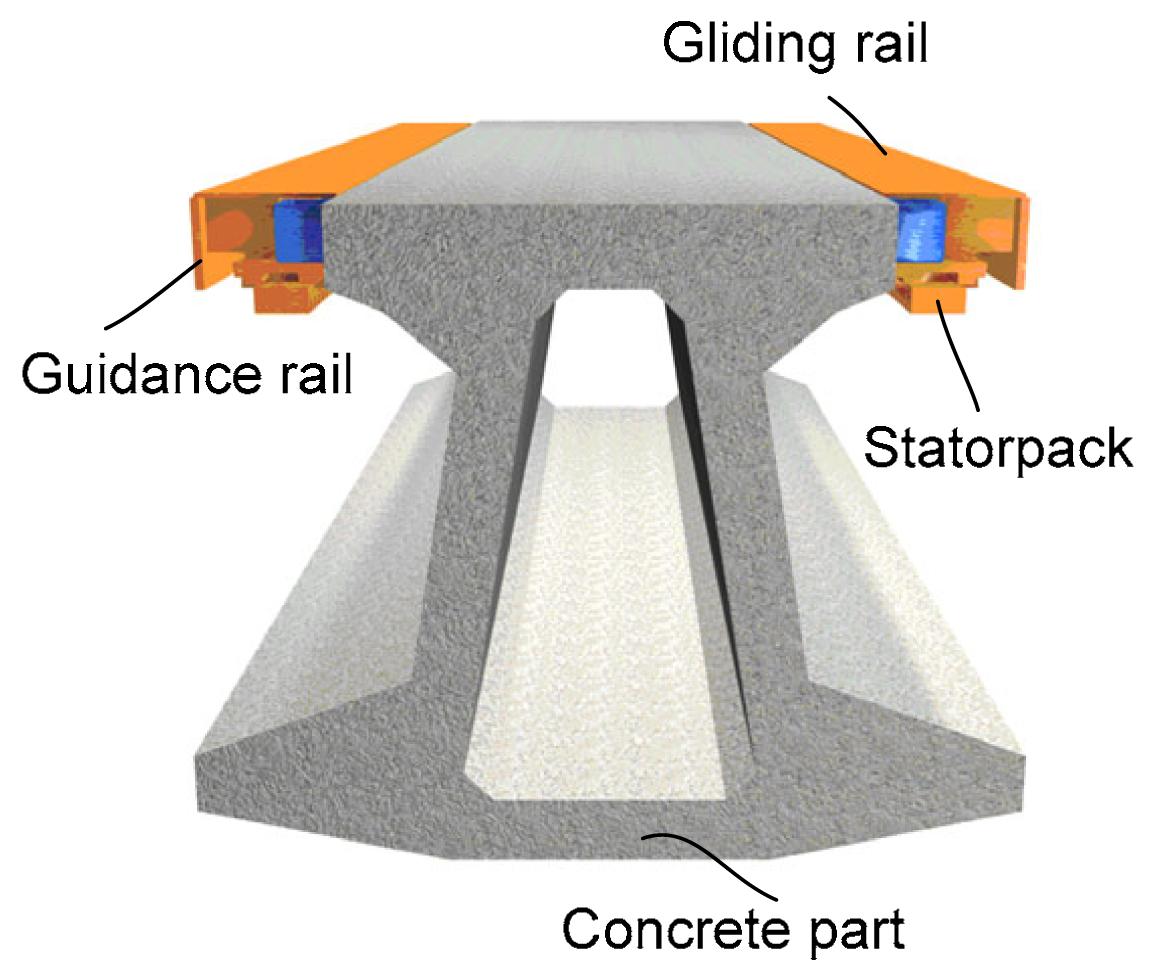
Guideway girders of the high speed maglev are precast in a girder factory and equipped with the system components of a statorpack, guidance rail, and gliding rail, and then assembled on site as a part of the space curve (Fig. 2). A series of these functional components 3.096 m long are installed on a 24 m-span girder using high strength bolts.
Fig.2 Girder structure of the high speed maglev
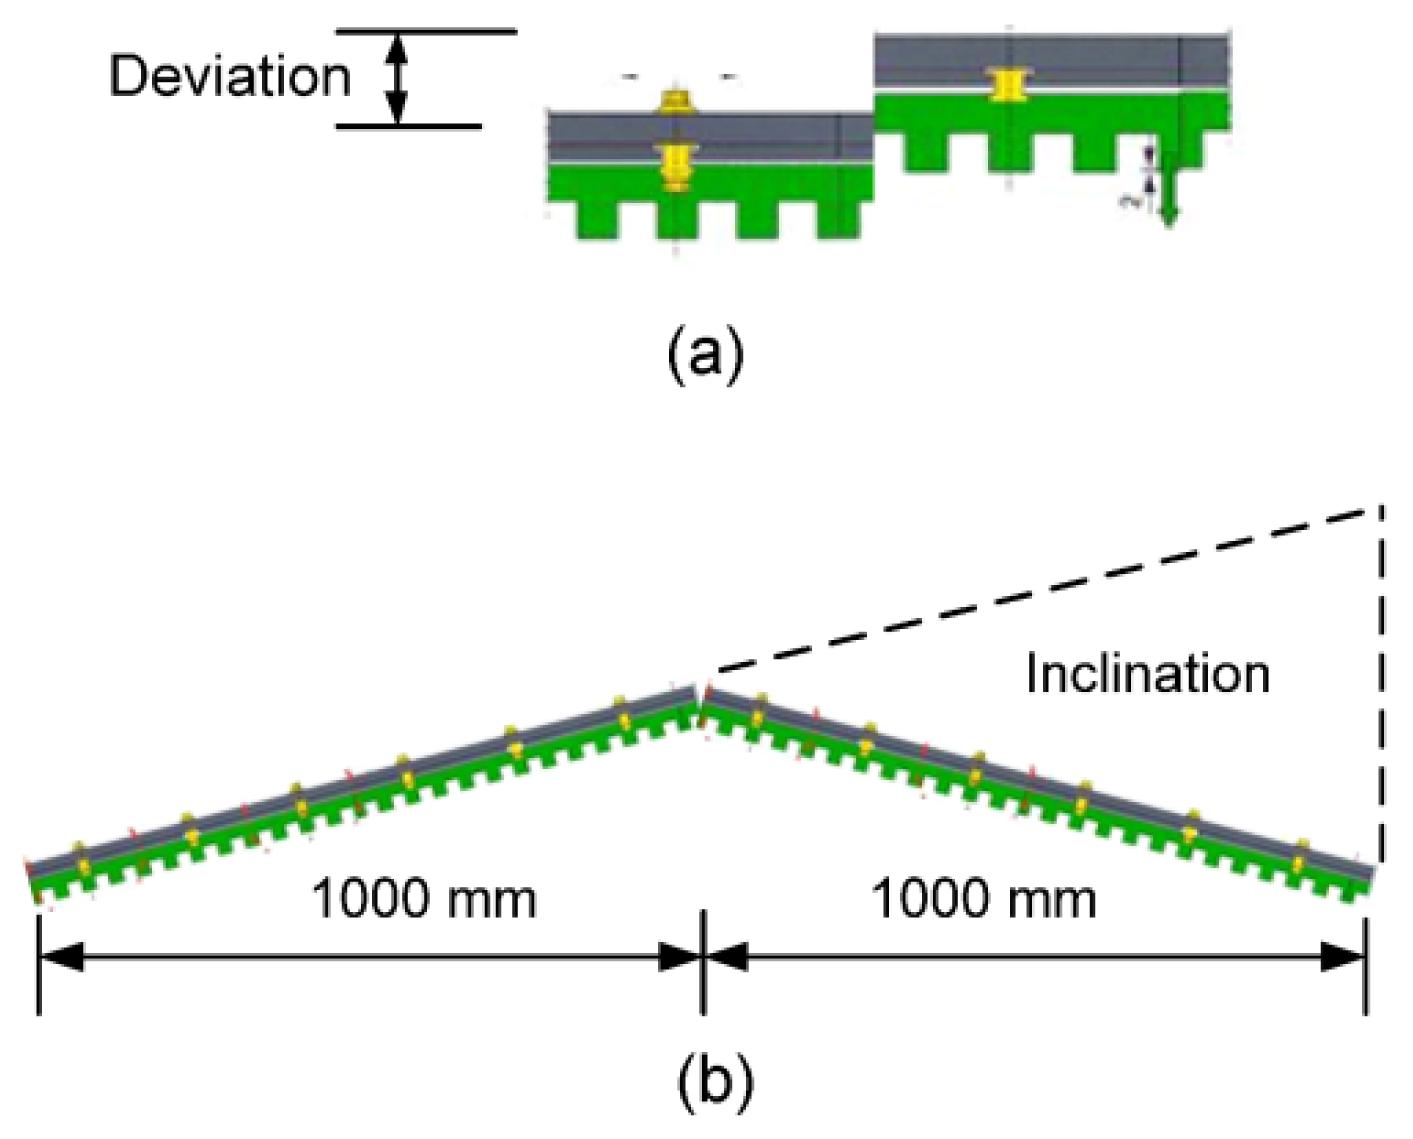
After transportation to the installation site on the route, the guideway girders are mounted and fine-positioned at the girder joints, and thereby assigned to the defined space curve. High standard geometric specifications are used to control deformation and deviation of the guideway, but track irregularities are unavoidable. Track irregularities may be caused by deviation and inclination of the stator plane (Fig. 3), subsidence of the foundation, machining error of functional components, or temperature deformation of the girder.
Fig.3 Error of the stator plane Deviation (a) and inclination (b) of the stator plane
According to the specifications of the high speed maglev (Schwind, 2006), the deviation tolerances for the stator plane are 0.4 mm (in every girder) and 0.6 mm (between two girders). The permissible maximum change of inclination of the stator plane is 1.5 mm/m. For the guidance rail plane, the permissible maximum value is 2.0 mm/m. The permissible temperature deformation of the girder is about L/5400–L/6500 (L is the length of a girder, in m). For subsidence of the foundation, a value of about L/4500–L/6000 is permitted.
3. Methods for testing track irregularities
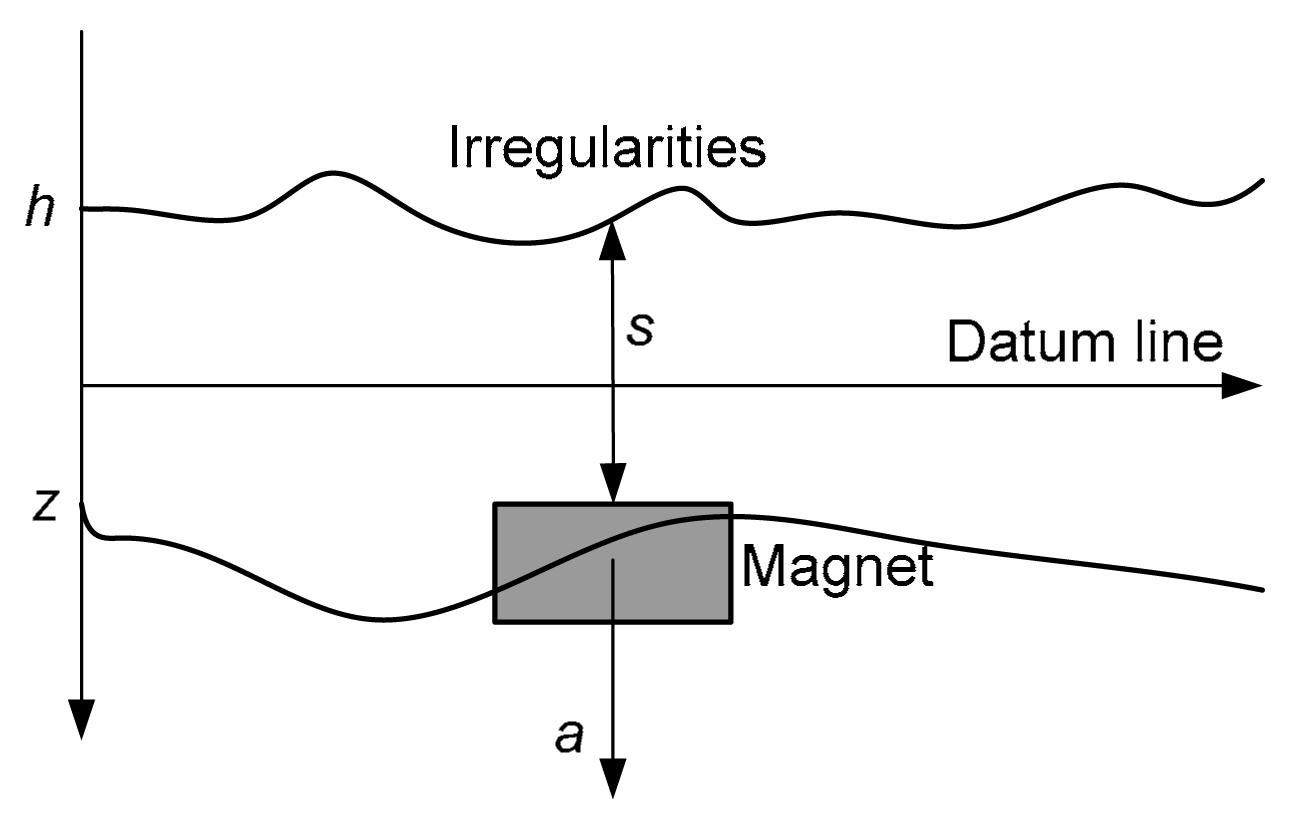
An inertial reference method has been developed and used for maglev systems to measure track irregularities (Fig. 4). The system is established by means of vibration acceleration of a magnet, and track irregularities are calculated by air gap and magnet displacement. The value of the irregularities (h) is determined by , where a is the acceleration of the magnet, t is the time, s is the air gap between the magnet and the guideway, and z is the displacement of the magnet.
Fig.4 Principles for measuring irregularities on a high speed maglev line
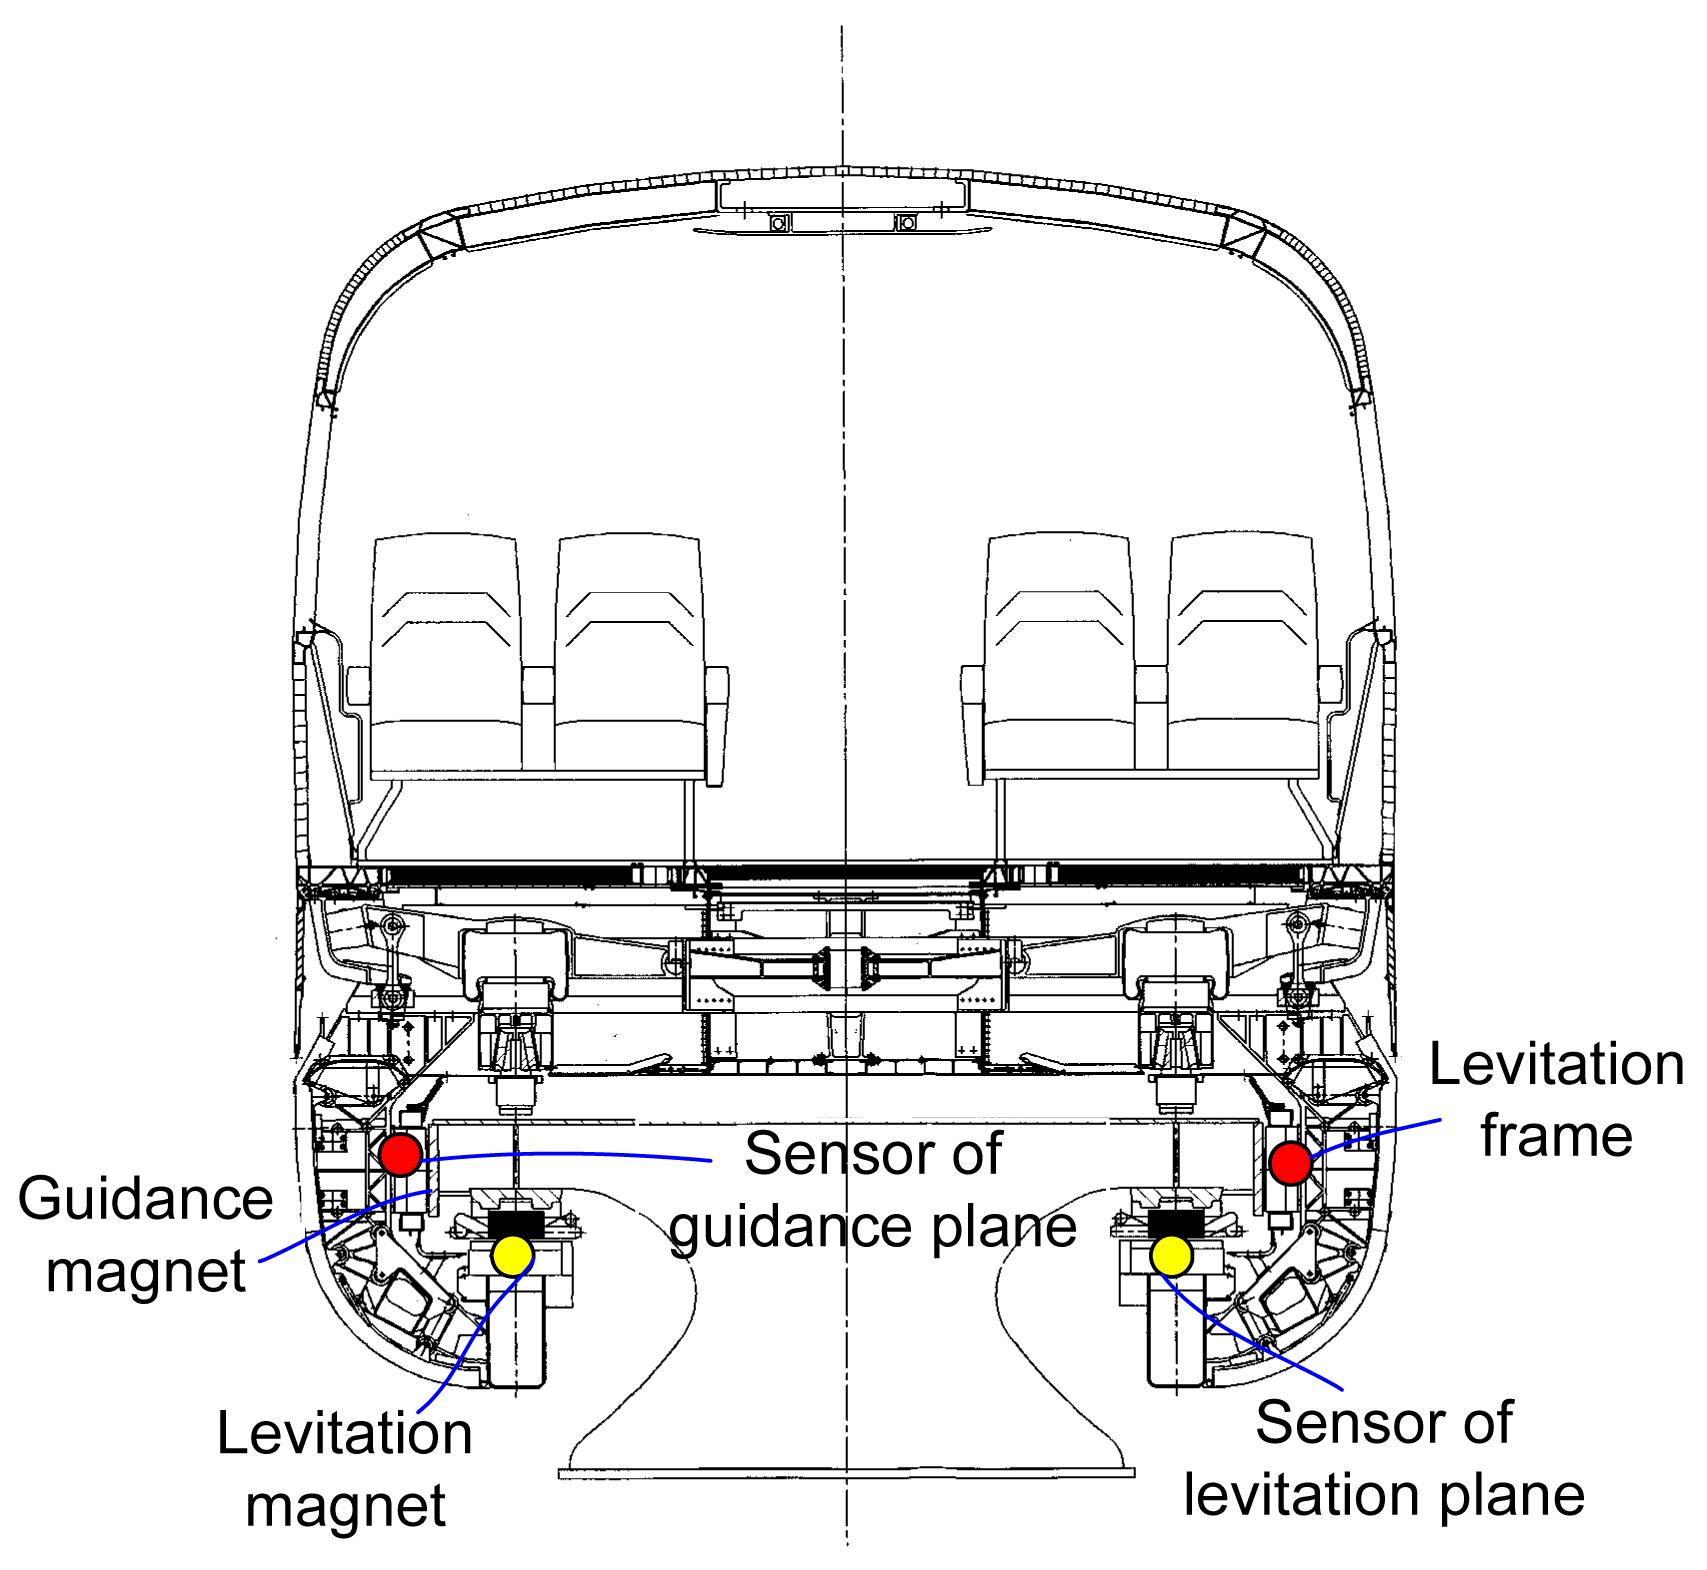
The hardware for recording and evaluating the measurement data, including acceleration and air gap data, has been completely integrated into the overall architecture of the vehicles. The acceleration data of the magnet is measured by acceleration sensors installed in electromagnetic modules (Fig. 5). Air gap data are obtained from vehicle-own gap measurement units.
Fig.5 Acceleration sensors installed in electromagnetic modules
4. Methods for digital processing of track irregularities
4.1. Processing method
To reduce integral saturation due to the longwave composition of the space curve, partial filters are used in acceleration signal processing. The transfer function of a partial filter is given by (Arulampalam et al., 2002; Deng, 2005) , where ωd is the cut-off frequency, which is determined according to experience.
A partial filter is designed by zero pole matching in frequency domain. ωd determines the attenuation characters and transition band. In other words, when ωd is small, the amplitude-frequency character in the passing band is flatter, the attenuation of direct-current parameters is better, and the transition band is narrower. But if ωd is too small, the transition band will be too narrow and the signal attenuation will not be sufficient near the pole frequency. As a result, the low-frequency components will not be filtered effectively. So ωd should be chosen according to actual application. Following analysis and simulation of the acceleration signal on a curved part of the line, we adopted ωd=1/20 000 rad/s. The low-frequency components are filtered from the irregularities thus obtained, thereby improving the filtering result and system stability.
After partial filtering of the signal, a rectangle method is used for acceleration integration. The method is used to compute an approximation of a definite integral. It accumulates the area of a series of rectangles whose heights are determined by the values of the acceleration signal, and whose widths are time steps. Specifically, the time interval over which the signal is to be integrated is divided into M equal subintervals of length Tm. The approximation of the integral is then calculated by adding up the areas of the M rectangles, i.e., , , where m=2, 3, …, M, f″(m), f′(m), and f(m) are the acceleration, velocity, and displacement of the magnet at the mth time step, respectively.
The frequency of testing signals based on equal time sampling is 10 000 Hz. To eliminate velocity effects, a resampling method is used to transform the time signal into spatial domain signal. Because wave crests and troughs of velocity signal obtained from vehicle-own measurement units are caused by the tooth and slot sequence of the stator pack, the displacement and air gap signal in spatial domain can be obtained by resampling the signal of the pulse edges at 86 mm intervals (the distance between teeth).
Based on the partial filtering, integration and resampling of the signal, the values of the initial irregularities are determined.
A low pass Butterworth filter is designed for initial processing of irregularities. The transfer function of the Butterworth filter is given by , where ωc is the cut-off frequency, and N is the order of the filter.
Fig. 6 shows the gain of a discrete-time Butterworth filter. As N approaches infinity (from N=1, 3, 5, …), for smaller values of N, the cut-off will be less sharp. In this study, the cut-off wavelength of the passband was selected as 180 m (the circular frequency of the passband ωp was 0.0348 89 rad/s), and the cut-off wavelength of the stopband was selected as 165 m (the circular frequency of the stopband ωs was 0.038 061 rad/s). The value of the cut-off frequency was determined according to wavelength analysis, as described in the next section.
Fig.6 Gain of a discrete-time Butterworth filter
The passband and stopband attenuated into the damping of the transfer function, and suppressed noise at high frequencies. According to the filter design parameters given by Zheng et al. (2007), the pass band attenuation As was 0.0275 dB, and the stop band attenuation Ap was −50 dB.
According to the characteristics of the Butterworth filter (Siebert, 1986): , where As is the pass band attenuation, and Ap is the stop band attenuation. Let N=30, and put N into the passband equation: .
Accordingly, the cut-off wavelength can be calculated by , where Ω is the space frequency (m−1).
According to the calculation results, the filter parameter N was 30 and the cut-off space frequency was 1/170 m−1.
4.2. Processing results
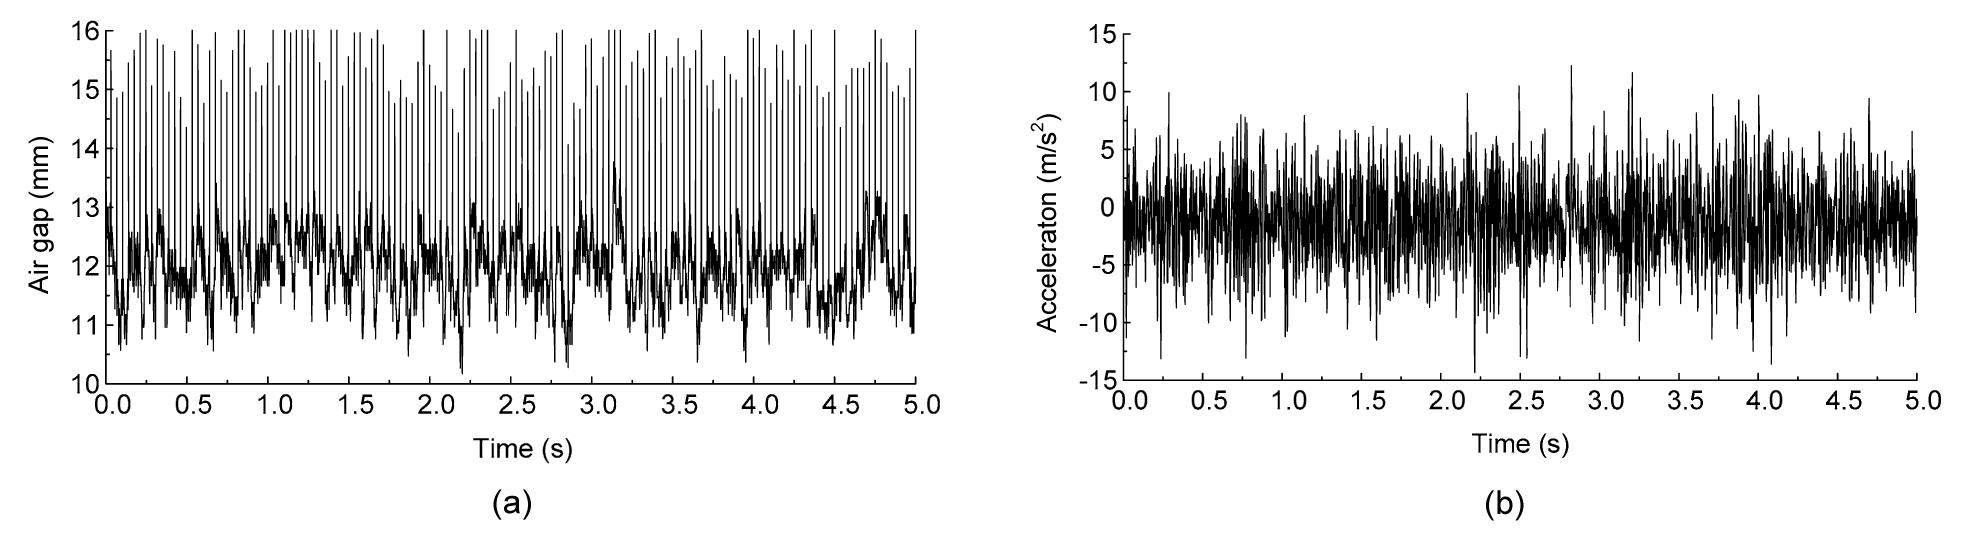
The measurement principle was developed and applied to the daily operations of the high speed maglev line. Field data from the maglev line were recorded in 2010. The sampling frequency was 1/10 000 Hz. In this study, the data were acquired from DK17+000.00 to DK17+600.00 on the maglev line where the running speed was 430 km/h. Fig. 7 shows the air gap and acceleration of the levitation magnet, and Fig. 8 shows the air gap and acceleration of the guidance magnet. The change in the air gap of the levitation magnet was found to be in the range of −2 mm–+2 mm, and the maximum acceleration of the magnet was about 40 m/s2 (4g). The change in the air gap change of the guidance magnet was found to be in the range of −1.25 m–+1.25 mm, and the maximum acceleration of the magnet was about 10 m/s2 (1g). The change in the levitation air gap was greater than that of the guidance air gap due to vertical deformation induced by train loads. The pulse signals that appeared at 24 m intervals (Fig. 7a) indicated the levitation gap signal between two girders, and those that appeared at 3.096 m intervals (Fig. 8a) indicated the guidance gap signal between two functional components. The above pulse signals were recorded to determine the precise position of the deviation on the girders.
Fig.7 History of air gap (a) and acceleration (b) of levitation magnet
Fig.8 History of air gap (a) and acceleration (b) of guidance magnet
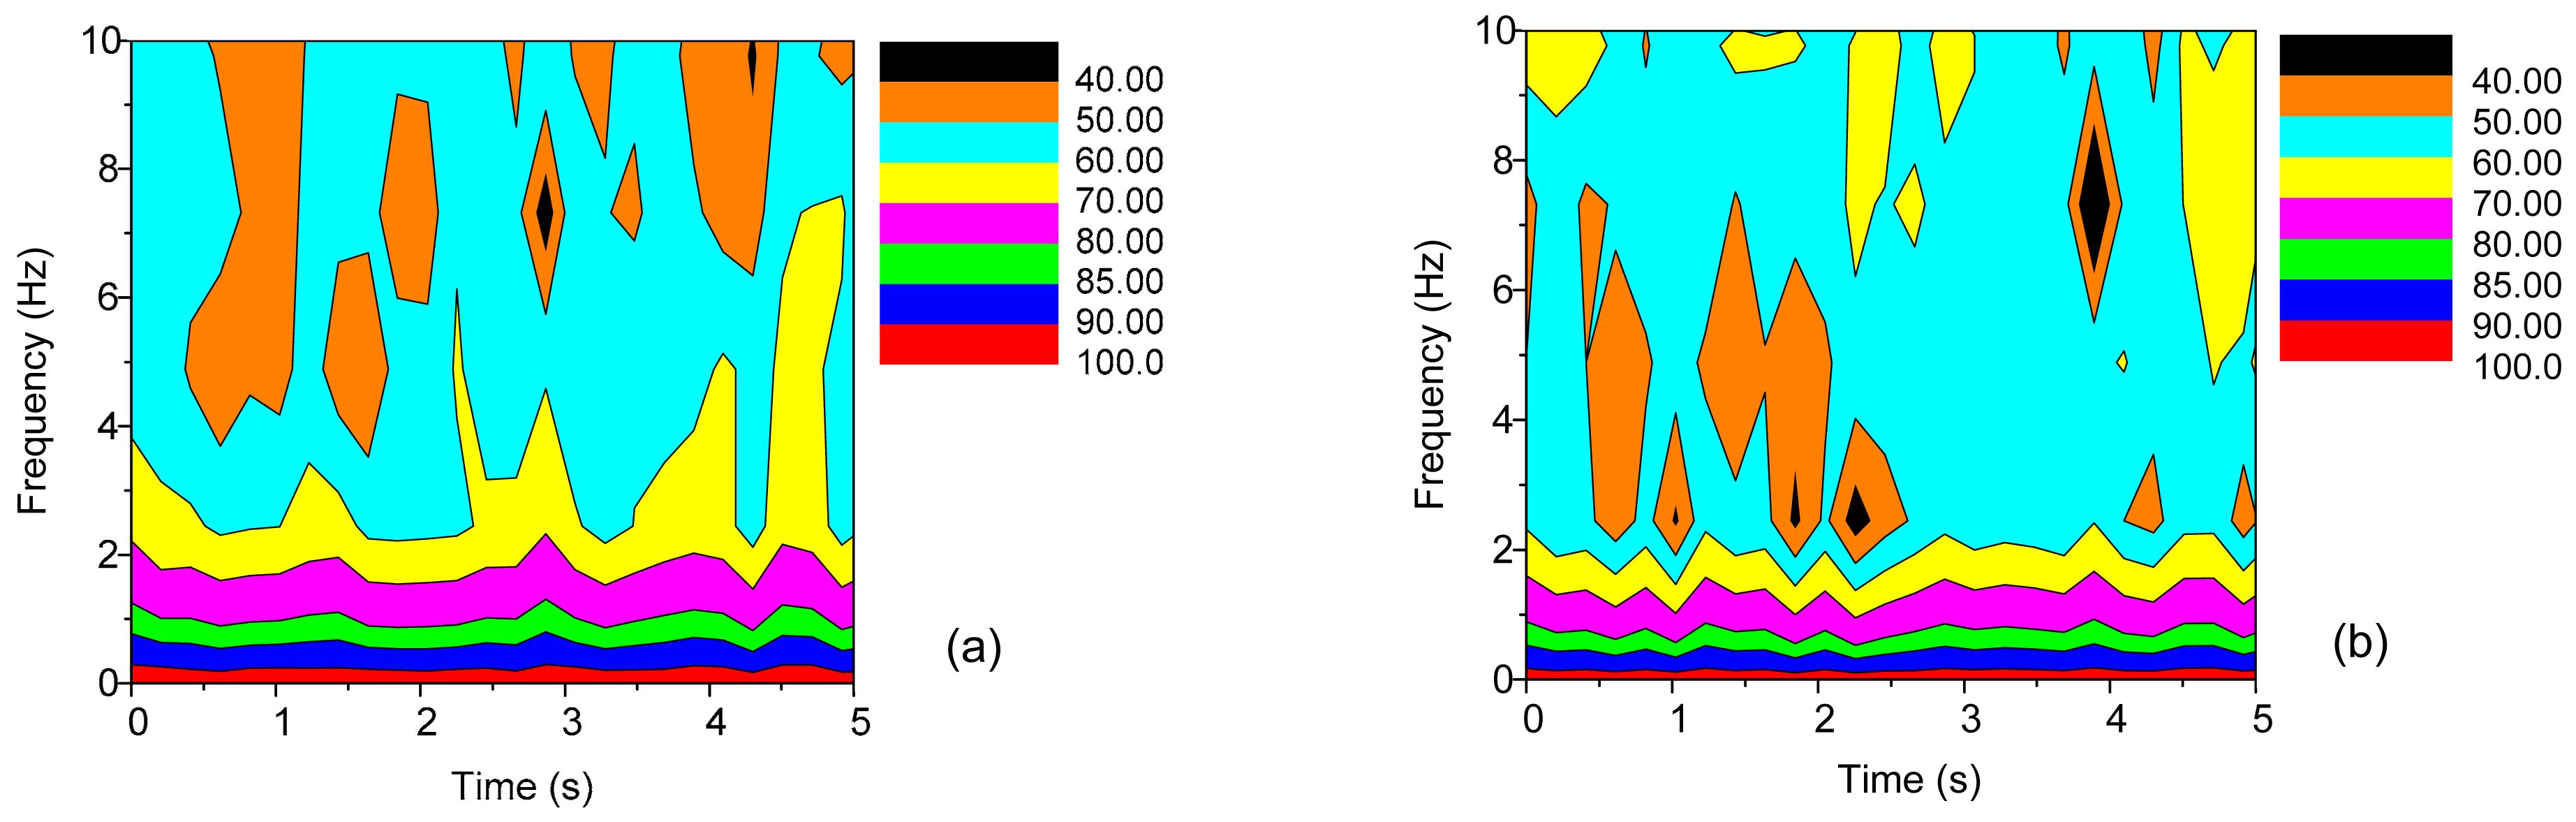
The measured signals were analyzed using short-time Fourier transform (STFT), which is used to determine the sinusoidal frequency and phase content of local sections of a signal as it changes over time. Fig. 9 shows spectrograms of the air gap and acceleration of the levitation magnet, and Fig. 10 shows spectrograms of the air gap and acceleration of the guidance magnet, measured using STFT method. The stable peak energy of the air gap and acceleration occurred at about 0–2 Hz. To determine the cause of stable composition, the excitation wavelength causing a change in frequency composition was analyzed. The relationship between these two parameters is given by (Chen and Zhai, 2004) , where λ is the excitation wavelength (m), f is the frequency (Hz), and v is the running speed (m/s).
Fig.9 Spectrograms of the air gap (a) and acceleration (b) of the levitation magnet (unit: dB)
Fig.10 Spectrograms of the air gap (a) and acceleration (b) of the guidance magnet (unit: dB)
The length of the maglev track beam was 25 m. Thus, for one beam, the irregularity in a wavelength range of 25 m was excited mainly by deviation of the stator and functional elements mounted on the beam. Due to continuous settings of the maglev track beam, the irregularity at a wavelength of an integer multiple of the beam length was excited mainly by support settlement. The length of the curve of the test section in the maglev line was about 500 m. Therefore, the components of the wavelength above contained long wave irregularity components excited by spatial curved settings. According to Eq. (6), the excitation wavelength and the cause of the stable composition are summarized in Table 1.
Table 1
Relationship between excitation wavelength and frequency composition
Frequency (Hz)
Excitation wavelength (m)
Note
<0.25
>475
Induced by design of space curve, a wide range of settlement of foundations, etc.
0.25–0.96
125–475
Induced by arrangement of girders, subsidence of foundations, etc.
0.96–2.4
50–125
2.4–4.8
25–50
>4.8
<25
Induced by single girder deformation, deviation, and inclination of functional components, etc.
The maximum peaks of air gap and acceleration occurred at about 0–0.25 Hz and were induced by the long wave composition of the space curve. Because this long wave composition has an effect on integration, it should be eliminated. Signals within 0.25–2.4 Hz corresponding to long wavelengths of 50–475 m are stable, which indicates that long wave irregularities are dominant on the high speed maglev line.
By this processing method, the initial irregularities can be determined. The cut-off frequency or wavelength of the Butterworth filter plays an important role in the final processing results. Vehicle resonance occurs when the excitation frequency (or wavelength) of irregularities is close to integer multiples of the vehicle natural frequency (Museros and Alarcón, 2005; Shi and Wang, 2011). Wavelengths which may result in vehicle resonance at different speeds are summarized in Table 2. Wavelength increases as speed increases, and if the maximum wavelength is 173 m, almost all wavelengths that affect maglev vehicle vibration can be embodied. In Section 4.1, based on the approximate value of 170 m wavelength, the cut-off wavelength of the passband and stopband were determined.
Table 2
Wavelength of irregularities of vehicle resonance at different speeds
Dominant frequency of vehicle (Hz)
Wavelength of irregularities (m)
100 km/h
200 km/h
430 km/h
500 km/h
0.8–2.0
34.7–13.9
69.4–27.8
149–59
173.6–69.4
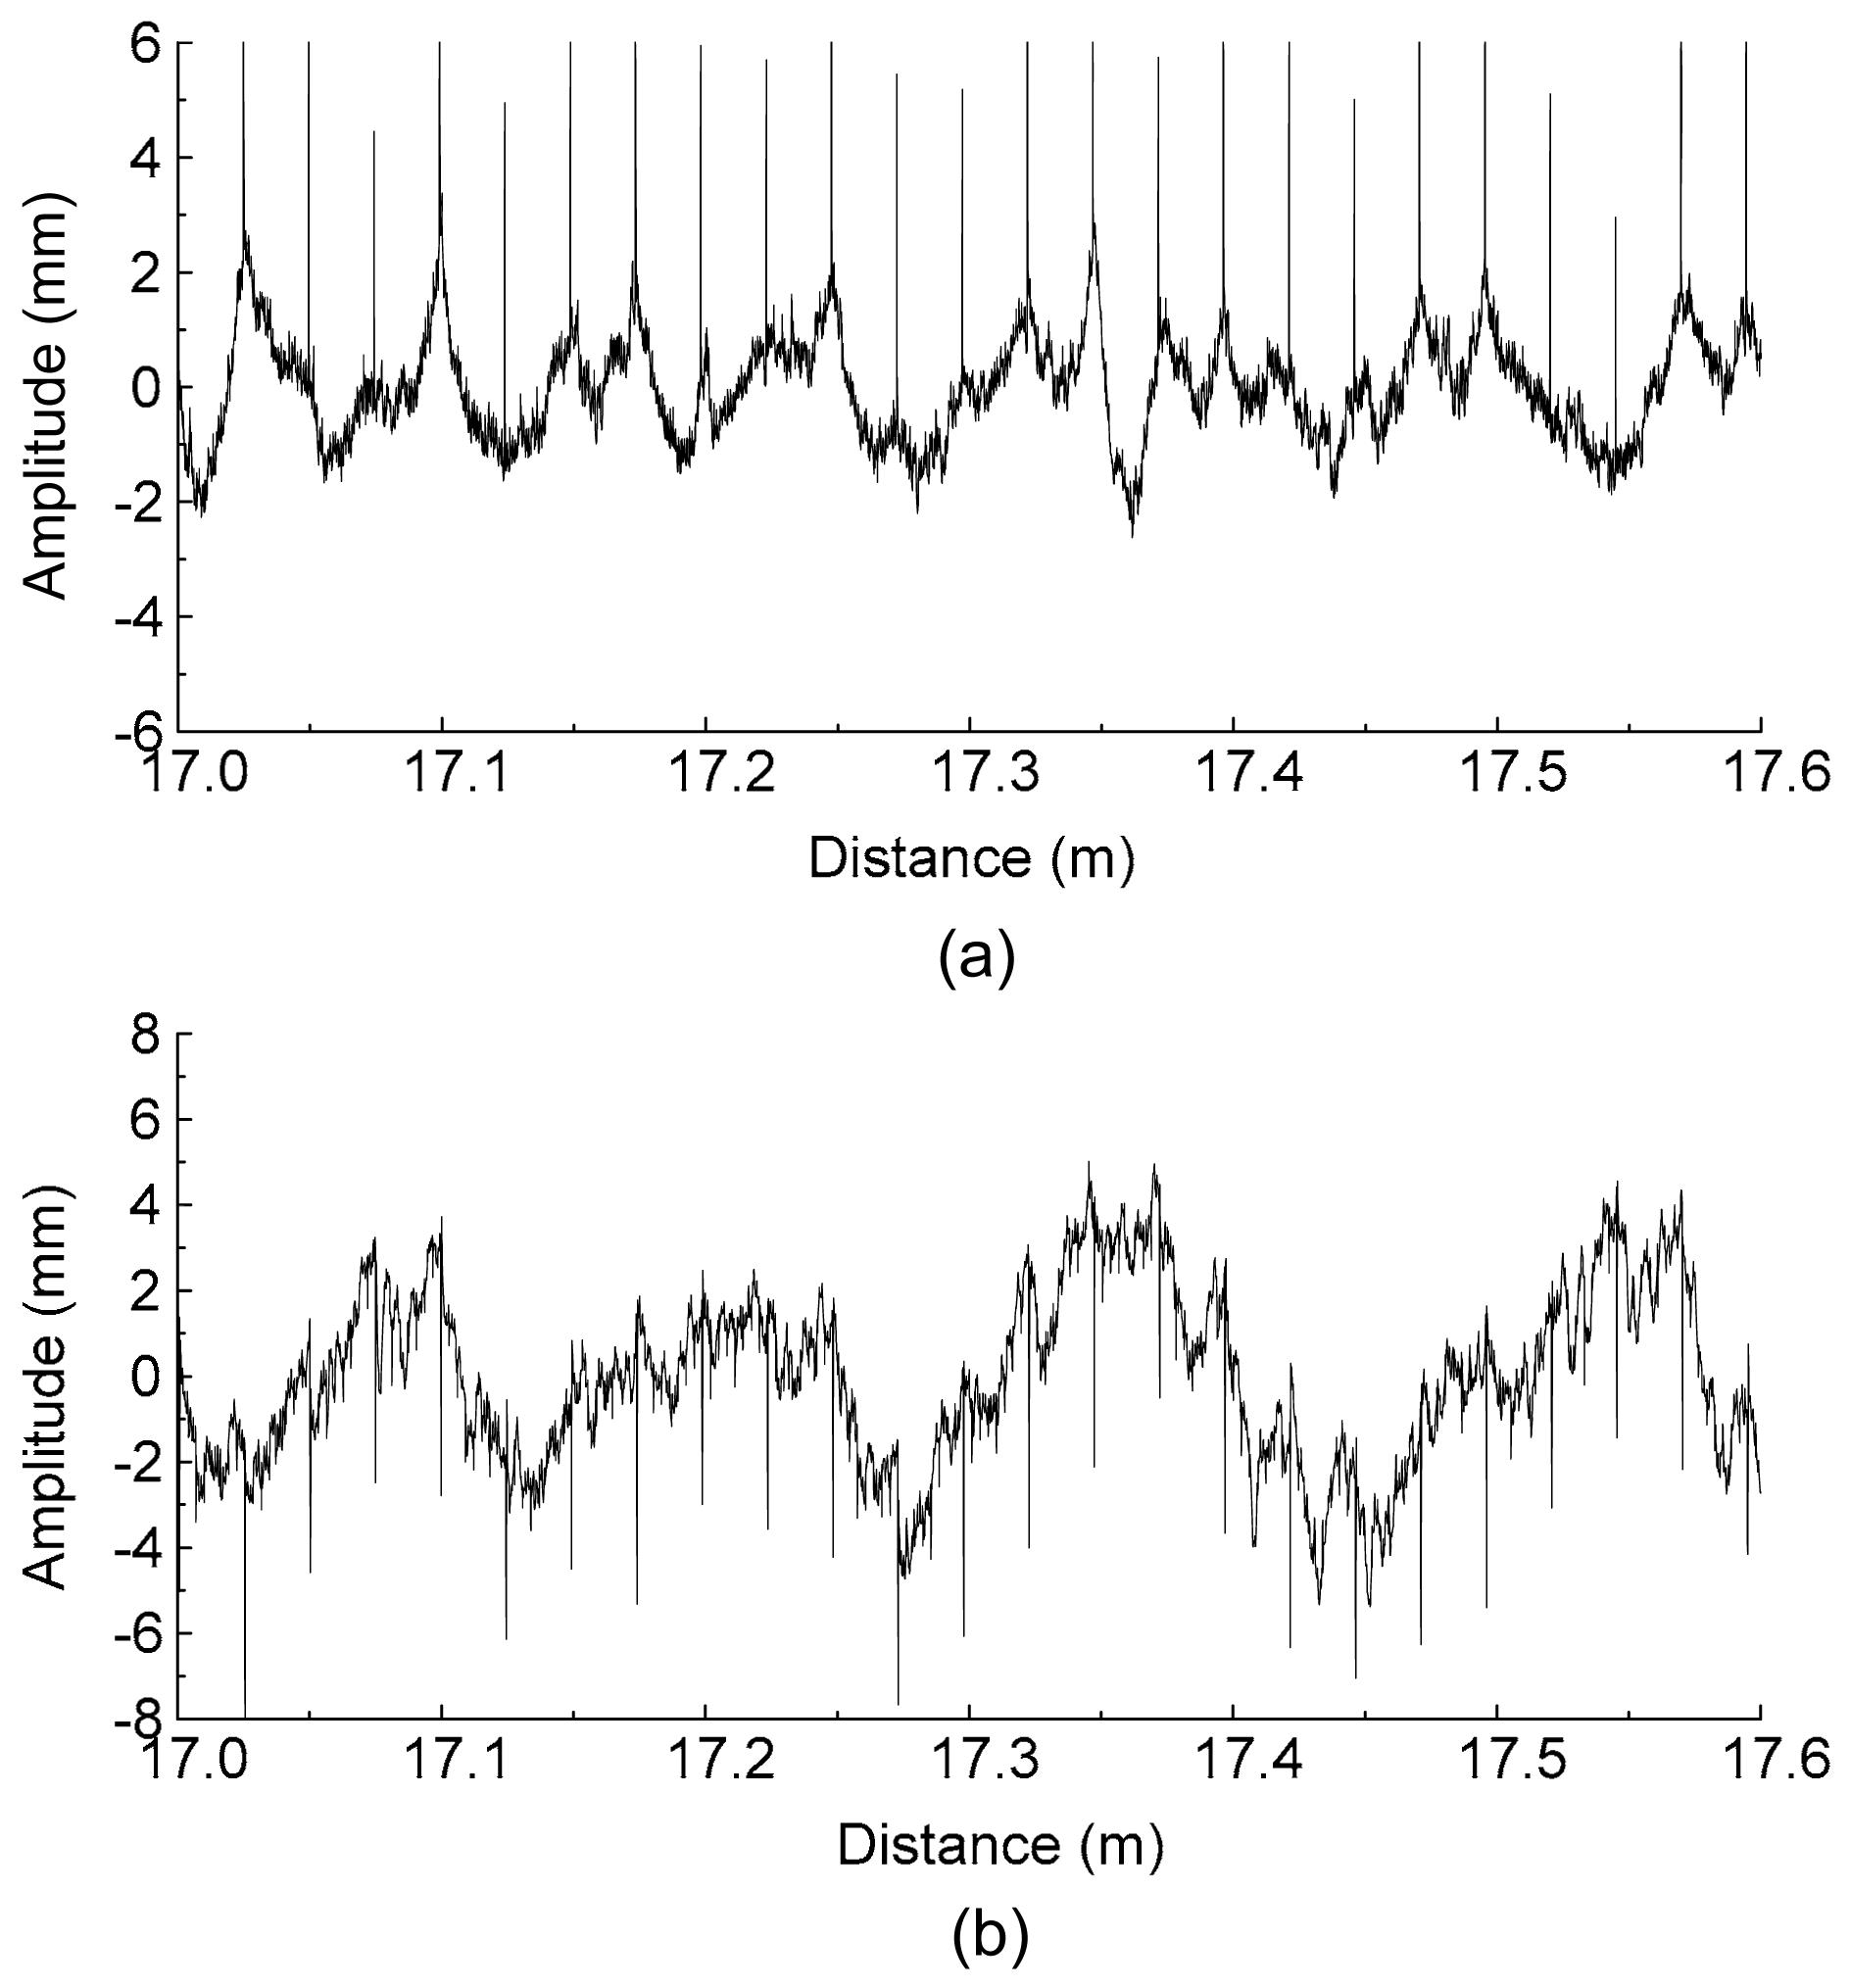
By using a processing method which includes partial filtering, integration, resampling of signal, and a low pass Butterworth filter, the irregularities of the maglev line were calculated. Fig. 11 shows the final irregularities of the stator and guidance plane from DK17+000.00 to DK17+600.00 on the maglev line. The deviation of the girder end is apparent. The maximum deviation of the stator is about 2 mm and of the guidance plane, about 4.5 mm. Irregularities of the stator plane are a little smaller than those of the guidance plane due to the high design standard of the stator. In addition, a series of pulse signals between two girders were recorded to determine precise position of the deviation.
Fig.11 Irregularities of the maglev line measured on-site (a) Stator plane; (b) Guide plane
5. Power spectrum density analysis of track irregularities
In railway engineering practice, track irregularities are frequently characterized by a one-sided PSD function of the track geometry. PSD functions of rail irregularities have been studied by many railway researchers. The Federal Railroad Administration (FRA), USA developed a system of classification for track quality (Fries and Coffey, 1990). The class of a track section determines the maximum possible running speed limit and traffic capacity of passenger trains. The PSD functions for class-5 and class-6 tracks (FRA5 and FRA6, respectively) are applied to passenger railways at maximum speeds of 144 km/h and 176 km/h, respectively. German railway spectra of high irregularity (GRSHI) and low irregularity (GRSLI) are applied to general railways and high speed railways with train speeds of over 250 km/h, respectively (Yang et al., 2004; Xia and Zhang, 2005).
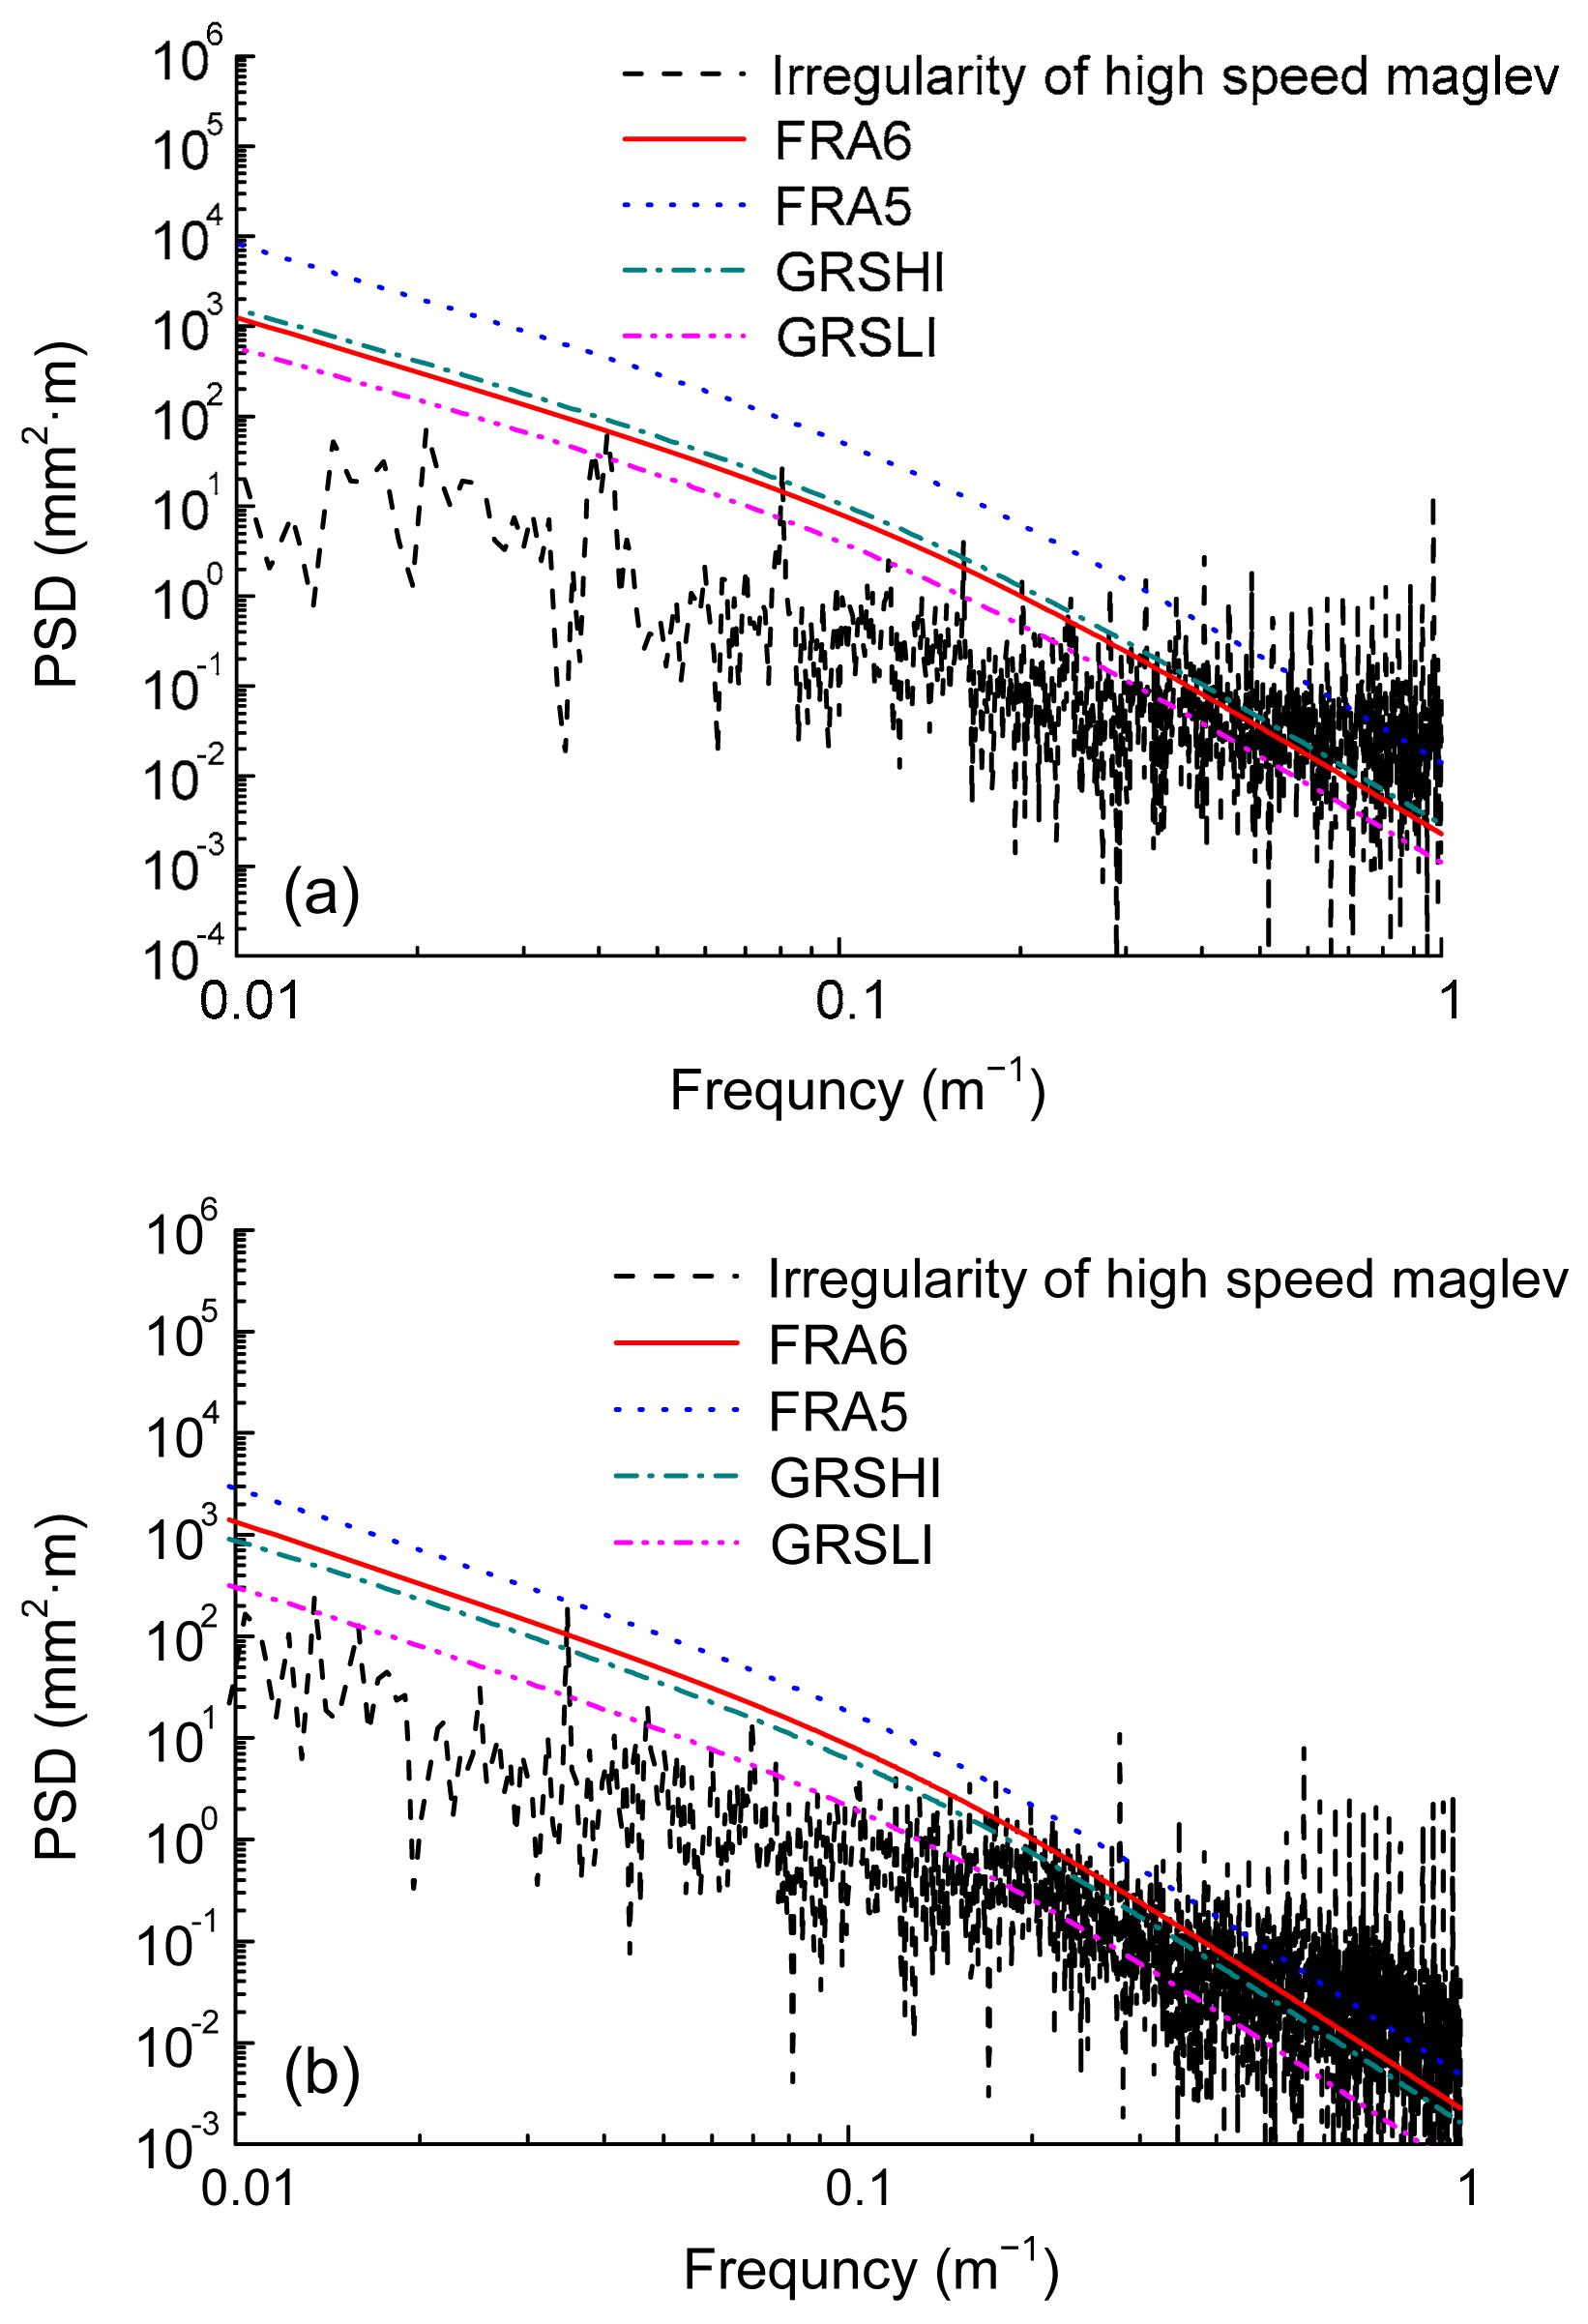
The track irregularity data of the high speed maglev line were collected in 2010 and evaluated by the above method in this study as an example of a maglev line. The track length is 2000 m (from DK17+000.00 to DK19+000.00), adopting 24 m-span simple girders all along. The sampling velocity was 430 km/h and the space length 0.086 m in this section. By fast Fourier transform (FFT), the PSD of the maglev irregularities can be obtained (Fig. 12). For comparison with railway irregularities, the PSDs of FRA5, FRA6, GRSHI, and GRSLI are also shown in Fig. 12. Fig. 12a shows that the PSD of the maglev stator plane irregularities is smaller than that of the vertical GRSHL within a wavelength range of 5–100 m corresponding to space frequency of 0.01–0.2 m−1 according to Eq. (8), which indicates that the track quality of the maglev line is better than that of railway lines within this wavelength range. As the PSD is larger than that of railway vertical rail irregularities within a wavelength range of 1–5 m corresponding to space frequency of 0.2–1 m−1, the track quality of the maglev line is worse at smaller wavelengths. The PSD of maglev guidance plane irregularities is close to that of cross level GRSHL within a wavelength range of 10–100 m corresponding to space frequency of 0.01–0.1 m−1, and obviously larger than that of railway cross level rail irregularities in a wavelength range of 1–10 m corresponding to space frequency of 0.1–1 m−1 (Fig. 12b), which indicates that the track quality of the maglev line is better than that of railway lines when the irregularity wavelength is larger. We suggest that short wavelength track irregularities of maglev lines are caused by deviation and inclination of the stator plane, and that the machining error of functional components should be strictly controlled during construction and maintenance.
Fig.12 Power spectral density (PSD) with different irregularities (a) Comparison of the PSDs of the stator plane and railway vertical track; (b) Comparison of the PSDs of the guidance plane and railway lateral track
6. Fitting of the irregularity spectrum of a high speed maglev guideway
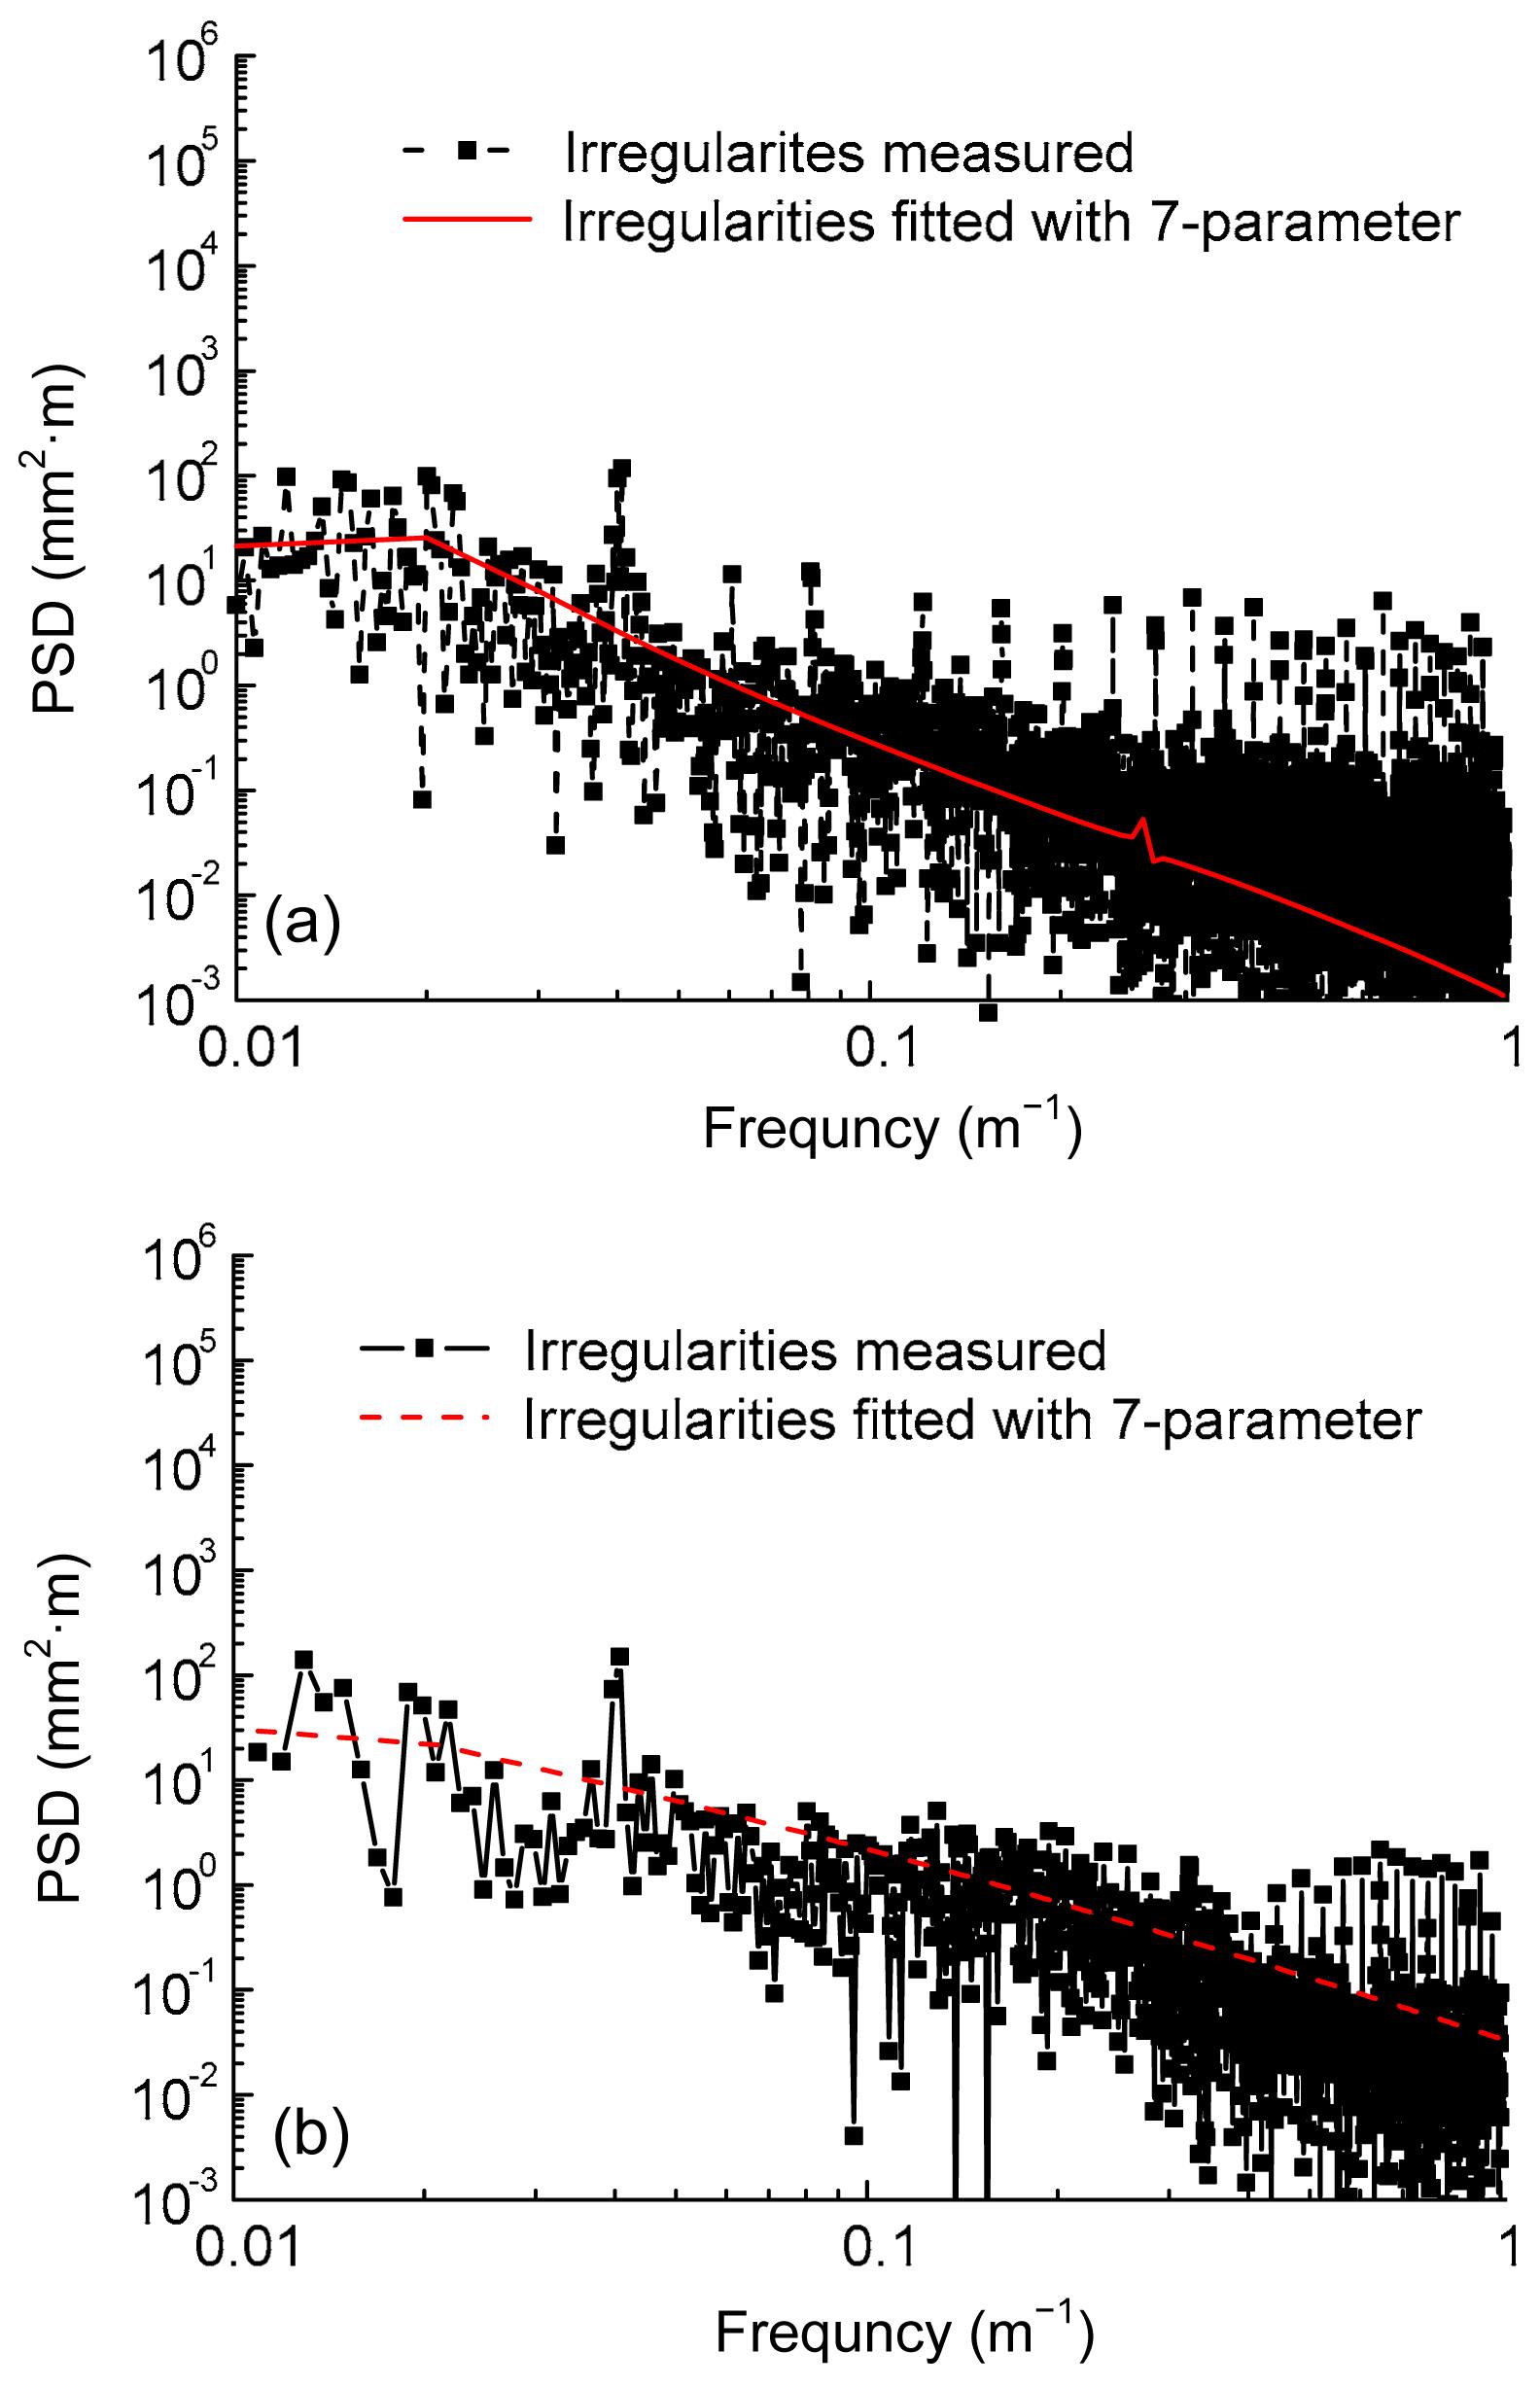
PSD is a statistical curve gained from a large number of samples. It is usually described as a nonlinear function which, for convenience, approximates to the spectral density function. We adopted a 7-parameter fitting function to describe maglev line irregularities, by reference to foreign and domestic rail transit PSDs (Chen et al., 2008): , where S(Ω) is the PSD (mm2·m), and A, B, C, D, E, F, and G are spectral characteristic parameters.
According to Eq. (7), the track irregularity data of the high speed maglev line was collected and fitted by the least square method (Table 3). A comparison between fitted and actual PSDs is shown in Fig. 13. The fitted PSD is almost identical to the actual PSD. The fitted PSD is obviously divided into two sections, whose wavelengths are 50–100 m and 1–50 m corresponding to space frequencies of 0.01–0.2 m−1 and 0.2–1 m−1, respectively. The fitted PSD provides not only a unified expression of track irregularities for a high speed maglev line, but also a system excitation source for dynamic analysis of the vehicle and guideway.
Table 3
Spectral characteristic parameters of PSD function
Plane
A
B
C
D
E
F
G
Stator plane
0.109 85
−2.249 78
0.542 37
−100.786 99
30.531 82
−0.897 44
0.008 69
Guidance plane
0.033 91
35.513 35
−0.428 13
32.463 66
1.902 77
−0.032 11
3.495 49×10−5
Fig.13 Comparison between fitted and actual PSDs (a) PSD of the stator plane; (b) PSD of the guidance plane
7. Conclusions
The track irregularities of the high speed maglev line were measured, and then the field data were processed to study their characteristics and wavelength sensitivity. Finally, the PSD functions of the maglev line were compared with those of railway lines. The following conclusions can be drawn:
A measurement principle and processing method were developed and applied to the daily operations of the high speed maglev line. The implementation steps were as follows: partial filtering, integration, resampling of signal, and low pass Butterworth filter. By using this processing method, the irregularities of the maglev line could be determined.
Based on the amplitudes of time domain samples, the deviation of the girder end was apparent. The maximum deviation of the stator was about 2 mm and of the guidance plane, about 4.5 mm. Irregularities of the stator plane were a little smaller than those of the guidance plane due to the high design standard of the stator.
The PSD of the maglev stator plane irregularities was smaller than that of vertical GRSHL within a wavelength range of 5–100 m, indicating that the track quality of the maglev line is better than that of railway lines within that range. As the PSD is larger than that of railway vertical rail irregularities within a wavelength range of 1–5 m, the track quality of the maglev line was worse within this lower range. The PSD of the maglev guidance plane irregularities was close to that of the cross level GRSHL within a wavelength range of 10–100 m, and obviously larger in a wavelength range of 1–10 m (Fig. 12b), indicating that the track quality of the maglev line is better than that of a railway line when the wavelength of the irregularities is larger. We suggest that short-wavelength track irregularities of a maglev line are caused by deviation and inclination of the stator plane, and that machining error of functional components should be strictly controlled during construction and maintenance.
Track irregularity data of the high speed maglev line were collected and fitted by the least square method. The fitted PSD was clearly divided into two sections, with wavelengths of 50–100 m and 1–50 m, respectively. The fitted PSD provides a unified expression of track irregularities for high speed maglev lines.
[1] Arulampalam, S., Maskell, S., Gordon, N., 2002. A tutorial on particle filters for online nonlinear/non-Gaussian Bayesian tracking. IEEE Transactions on Signal Processing, 50(2):174-188.
[2] Chen, G., Zhai, W.M., 2004. A new wheel/rail spatially dynamic coupling model and its verification. Vehicle System Dynamics, 41(4):301-322.
[3] Chen, X.M., Wang, L., Tao, X.X., 2008. Fitting method of track spectrum for main line railway in China. Journal of Traffic and Transportation Engineering, (in Chinese),8(1):19-22.
[4] Deng, T.B., 2005. Design of arbitrary-phase variable digital filters using SVD-based vector-array decomposition. IEEE Transactions on Circuits System, 52(1):148-167.
[5] Fries, R.H., Coffey, B.M., 1990. A state-space approach to the synthesis of random vertical and crosslevel rail irregularities. Journal of Dynamic Systems, Measurement, and Control, 112(1):83-87.
[6] Kwon, S.D., Lee, J.S., Moon, J.W., 2008. Dynamic interaction analysis of urban transit maglev vehicle and guideway suspension bridge subjected to gusty wind. Engineering Structures, 30(12):3445-3456.
[7] Lee, J.S., Kwon, S.D., Kim, M.Y., 2009. A parametric study on the dynamics of urban transit maglev vehicle running on flexible guideway bridges. Journal of Sound and Vibration, 328(3):301-317.
[8] Museros, P., Alarcn, E., 2005. Influence of the second bending mode on the response of high-speed bridges at resonance. Journal of Structural Engineering, ASCE, 131(3):405-415.
[9] Nieters, W., 2004. Guideway Monitoring during Operational Use on the First Transrapid Line in Shanghai. , The 18th International Conference on Magnetically Levitated Systems and Linear Drives, Bangkok, Thailand, :
[10] Schwind, G., 2006. Guideway. , The 19th International Conference on Magnetically Levitated Systems and Linear Drives, Dresden, Germany, :
[11] Shi, J., Wang, Y.J., 2011. Dynamic response analysis of single-span guideway caused by high speed maglev train. Latin American Journal of Solids and Structures, 8(4):213-218.
[12] Siebert, W.M., 1986. Circuit, Signal, and Systems, The MIT Press, McGraw-Hill Book Company,:
[13] Tsunashima, H., Abe, M., 1998. Static and dynamic performance of permanent magnet suspension for maglev transport vehicle. Vehicle System Dynamics, 29(2):83-111.
[15] Xia, H., Zhang, N., 2005. Dynamic analysis of railway bridge under high-speed trains. Compute Structure, 83(23):1891-1901.
[16] Yang, Y.B., Yau, J.D., Wu, Y.S., 2004. Vehicle-bridge Interaction Dynamics: with Application to High-speed Railways. World Scientific,Singapore :
[17] Yau, J.D., 2009. Vibration control of maglev vehicles traveling over a flexible guideway. Journal of Sound and Vibration, 321(1):184-200.
[18] Yau, J.D., 2010. Interaction response of maglev masses moving on a suspended beam shaken by horizontal ground motion. Journal of Sound and Vibration, 329(2):171-188.
[19] Zhao, C.F., Zhai, W.M., 2008. Maglev vehicle/guideway vertical random response and ride quality. Vehicle System Dynamics, 38(3):185-210.
[20] Zheng, S.B., Lin, J.H., Lin, G.B., 2007. Implementation of detection maglev track long wave irregularity based on inertial measurement principle. Journal of Electronic Measurement and Instrument, (in Chinese),21(1):61-65.
[21] Zhou, D.F., Li, J., Hansen, C.H., 2012. Suppression of the stationary maglev vehicle-bridge coupled resonance using a tuned mass damper. Journal of Vibration and Control, 33(10):1-13.
Open peer comments: Debate/Discuss/Question/Opinion


Open peer comments: Debate/Discuss/Question/Opinion
<1>