Affiliation(s):
1.
College of Civil Engineering, Hebei University of Technology, Tianjin 300401, China; moreAffiliation(s): 1.
College of Civil Engineering, Hebei University of Technology, Tianjin 300401, China; 2.
Civil Engineering Technology Research Center of Hebei Province, Tianjin 300401, China; 3.
College of Water Conservancy and Environment Engineering, Zhengzhou University, Zhengzhou 450001, China; less
Long-bang Qing, Wen-ling Tian, Juan Wang. Predicting unstable toughness of concrete based on initial toughness criterion[J]. Journal of Zhejiang University Science A, 2014, 15(2): 138-148.
@article{title="Predicting unstable toughness of concrete based on initial toughness criterion", author="Long-bang Qing, Wen-ling Tian, Juan Wang", journal="Journal of Zhejiang University Science A", volume="15", number="2", pages="138-148", year="2014", publisher="Zhejiang University Press & Springer", doi="10.1631/jzus.A1300261" }
%0 Journal Article %T Predicting unstable toughness of concrete based on initial toughness criterion %A Long-bang Qing %A Wen-ling Tian %A Juan Wang %J Journal of Zhejiang University SCIENCE A %V 15 %N 2 %P 138-148 %@ 1673-565X %D 2014 %I Zhejiang University Press & Springer %DOI 10.1631/jzus.A1300261
TY - JOUR T1 - Predicting unstable toughness of concrete based on initial toughness criterion A1 - Long-bang Qing A1 - Wen-ling Tian A1 - Juan Wang J0 - Journal of Zhejiang University Science A VL - 15 IS - 2 SP - 138 EP - 148 %@ 1673-565X Y1 - 2014 PB - Zhejiang University Press & Springer ER - DOI - 10.1631/jzus.A1300261
Abstract: The fracture processes of concrete were described by a cohesive crack model based on initial toughness criterion. The corresponding analytical method to predict the instability state was proposed. In this model, the initial toughness was adopted as the crack propagation criterion and the weight function method was used to calculate the stress intensity factor and the crack opening displacement caused by the cohesive stress. The unstable toughness can be easily obtained using the proposed method without measuring parameters at the critical state that was necessary in traditional methods. The proposed method was verified by existing experimental data of wedge splitting specimens with different grades of concrete and the sensitivity of the results on the tensile softening curve was discussed. The results demonstrate that the proposed method can well predict the peak load, the critical effective crack length, and the unstable toughness of concrete specimens. Moreover, the calculated unstable toughness is not sensitive to the tensile softening curve.
Darkslateblue:Affiliate; Royal Blue:Author; Turquoise:Article
Article Content
1. Introduction
A large number of experimental studies on concrete fracture have shown that an obvious fracture process zone (FPZ) exists at the crack tip (Bazant and Planas, 1998). The traditional linear elastic fracture mechanics (LEFM), is no longer applicable to the analysis of the concrete fracture process (Jenq and Shah, 1985a) when the size of FPZ is comparable to the structure. To date, numerous nonlinear models for concrete fracture have been developed from different perspectives and based on various assumptions. The primary models and their characteristics are briefly summarized herein.
The fictitious crack model (FCM) (Hillerborg et al., 1976) and crack band model (CBM) (Bazant and Oh, 1983) both considering the softening relation in the FPZ, were primarily solved numerically. The size effect law (SEL) developed by Bazant (1984) analyzes the size effect of the fracture by comparing nominal stress in the failure of structures with different sizes. The effective crack model (ECM) (Karihaloo and Nallathambi, 1990), known as the equivalent LEFM, has an explicit analytical solution. The two-parameter fracture model (TPFM) proposed by Jenq and Shah (1985a) was based on the assumption that crack propagation starts when the stress intensity factor and crack tip opening displacement (CTOD) reach their critical values. The critical stress intensity factor in both ECM and TPFM was calculated from the peak load Pmax and critical effective crack length ac using a formula developed in LEFM.
Three different stages in the concrete fracture processes have been identified, namely, crack initiation, stable crack propagation, and unstable crack propagation (Xu and Reinhardt, 1999a). To depict the three stages of crack propagation without compromising simplicity, Xu and Reinhardt (1999a) developed the double-K model, which employed the initial toughness and the unstable toughness as control parameters of the two important instantaneous states of crack initiation and instability, respectively. Macroscopic damage in concrete is believed to be initiated once the stress intensity factor at the crack tip reaches (Zhang and Xu, 2011). Crack instability is the catastrophic point between the stable and unstable crack propagation stages and is significant in investigating the mechanisms of concrete fracture. The double-K model has been playing an important role in engineering practice. For instance, and have been used in safety warning systems (DL/T 5332-2005, 2006) and in evaluating the performance of concrete structures with cracks.
The initial toughness can be easily obtained using formulae of the initial cracking load and initial crack length based on LEFM (Xu and Reinhardt, 1999a). Several measurement methods for the initial cracking load, such as tests using photo-elastic coating, laser speckle (Xu and Reinhardt, 1999a) and strain gauge (Zhang and Xu, 2011), and analytical methods have been formulated. Xu and Reinhardt (1999b; 1999c; 2000) proposed the double-K method and developed a simplified method later. Kumar and Barai (2009) developed a weight function method. The comparison of the above analytical methods can be found in (Zhang and Xu, 2011). Recently, Qing and Li (2013) proposed a theoretical method to obtain based on experimental peak load. Alternatively, as an easy method, Reinhardt and Xu (1999) and Zhang et al. (2010) determined the initial cracking load by the transition point that separates the linear and nonlinear segments of the load P-CMOD (crack mouth opening displacement) curve.
Nevertheless, predicting the unstable toughness is difficult without making any assumption. In the experimental aspect, can be calculated by the peak load Pmax and the critical effective crack length ac, which were mainly measured at the peak load state through the three point bending (TPB) specimens or wedge splitting (WS) specimens (DL/T 5332-2005, 2006). However, the critical effective crack length ac was usually difficult to measure accurately. In traditional methods, ac was calculated by critical crack mouth opening displacement CMODc through empirical formulae (Xu and Reinhardt, 1999b; 1999c; Kumar and Barai, 2009; Zhang and Xu, 2011). Furthermore, in the numerical aspect, a similar step-by-step procedure must be followed until the maximum load was reached (Wu et al. 2007; Dong et al., 2013). Therefore, it is of significance to establish a simple theoretical method for predicting the unstable toughness .
Based on the analysis of concrete fracture mechanisms, the current study attempts to develop an easy-to-use theoretical method for predicting the unstable toughness . In this method, the initial toughness was adopted as the control parameter of crack propagation and a weight function method was used to calculate the stress intensity factor and the crack opening displacement caused by the cohesive stress. Then the proposed method was verified using experimental data on wedge splitting specimens. The sensitivity of the results to the tensile softening curve was discussed.
2. Model development
2.1. Fracture processes of concrete
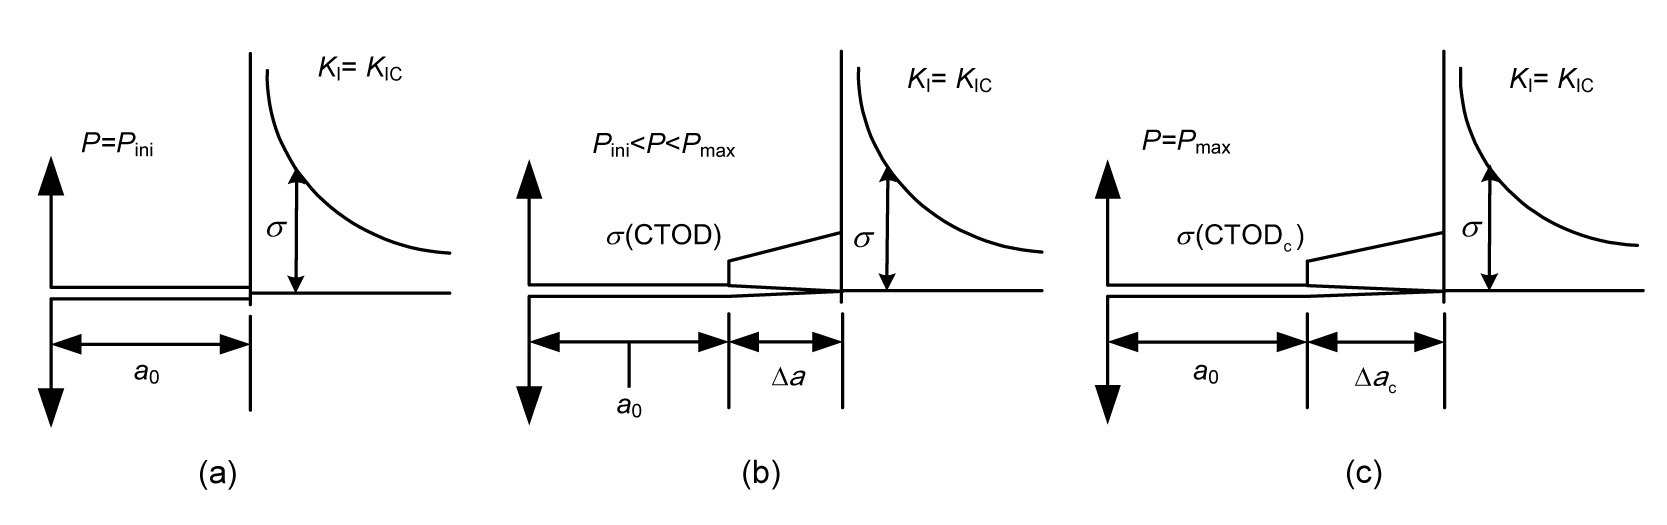
As mentioned in the previous section, the fracture processes in concrete structures include three different stages: crack initiation, stable crack propagation, and unstable fracture. To identify the three different states, the cohesive crack model with crack tip singularity (Elices and Planas, 1991) was adopted in the present work. Fig. 1 shows the different characteristics of the three stages, including the initial crack length a0, crack propagation length Δa, external load P, stress strength factor KI, and fracture toughness KIC. Take type I load for example. When concrete is subjected to monotonic loading, cracks will not propagate until the external load P reaches the crack initiation load Pini (P=Pini), and (Fig. 1a). After crack initiation and as the external load P continuously increases, the crack starts to propagate, and a cohesive zone forms ahead of the initial crack, as shown in Fig. 1b. This period is commonly known as the stable crack propagation stage. Then the external load P reaches the peak (critical) value Pmax (Fig. 1c). After that, unstable crack propagation may occur and the external load P decreases.
Fig.1 Three stages of the concrete fracture processes (a) Crack initiation; (b) Stable crack growth; (c) Unstable fracture
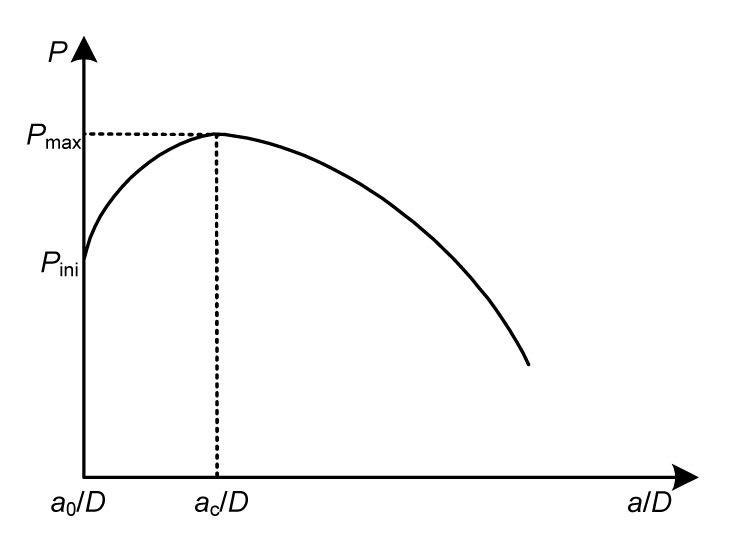
A typical P-a/D (a is the effective crack length, and D is the specimen height) curve is shown in Fig. 2 (Reinhardt and Xu, 1999; Kumar and Barai, 2008; Qing and Li, 2013). When P reaches the initial cracking load Pini, crack begins to grow and it gradually and nonlinearly increases with a. When P reaches the peak load Pmax, a=ac. Then P gradually decreases with a. The derivation of P to a at P=Pmax can be assumed to be continuous (Qing and Li, 2013). The maximum theory can also be adopted to predict the crack instability.
Fig.2 A typical P-a/D curve of concrete fracture (Qing and Li, 2013)
2.2. Criterion for concrete fracture
As discussed above, a crack is initiated in concrete once the external load reaches the crack load Pini or the stress intensity factor increases to the initial toughness . Thus, can be regarded as the toughness of the structural material to crack growth attributable to external forces. In the present study, the following criterion for crack initiation and propagation was employed (Xu and Reinhardt, 1999a; Wu et al., 2007; Dong et al., 2013):
,
where KI is the stress intensity factor at the tip of the effective crack tip in a mode I fracture.
Before crack initiation, LEFM can be applied, and KI can be calculated by
,
where KIP is the stress intensity factor attributable to the external load in a mode I fracture.
After the crack initiation, KI can be expressed by the superposition scheme:
,
where KIC is the stress intensity factor attributable to cohesive stress.
2.3. Cohesive stress distribution
It is assumed that the cohesive stress distribution on the FPZ can be expressed by Eq. (3) (Li et al., 2012). The cohesive stress at the tip of the effective crack equals the tensile strength. The cohesive stress at the tip of the initial crack and the crack tip opening displacement CTOD satisfy the tensile softening curve.
,
where σs is the stress on the initial crack tip, ft is the tensile strength, and m is the cohesion distribution index.
According to Eq. (3), the distribution of cohesive stress changes with the index m. When m=1, the cohesive stress distribution is linear. Eq. (3) is similar to the cohesive force distribution adopted by Reinhardt (1985). The difference is that the cohesive stress at the initial crack tip is not zero in the present model. Based on the theoretical model, the corresponding analytical approach is developed in the following section.
3. Analytical method for fracture
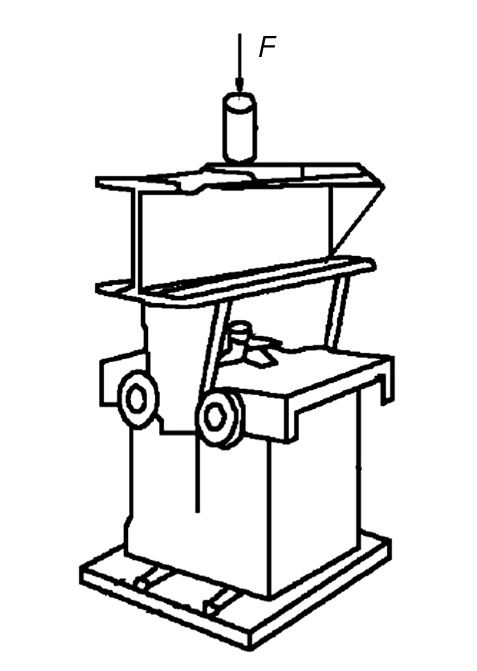
Take the WS specimen for example, the configuration of the WS specimen is shown in Fig. 3 (DL/T 5332-2005, 2006).
Fig.3 Test set-up of WS specimen (DL/T 5332-2005, 2006)
KIP can be expressed by (Xu and Reinhardt, 1999c):
,
where α=a/D, and k(α) is a geometric factor, which can be calculated by (DL/T 5332-2005, 2006):
.
Eq. (5) is valid for 0.2≤α≤0.8 with 2% accuracy (Xu and Reinhardt, 1999c).
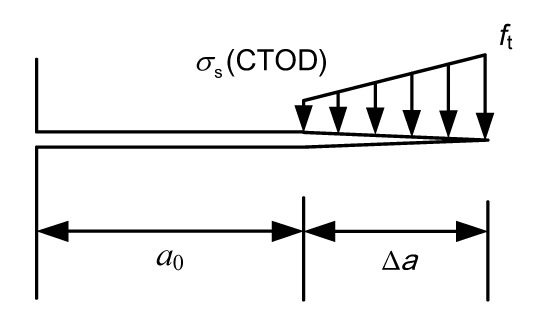
To obtain the value of KIC, a distribution of cohesive stress is assumed on the fictitious crack in an infinite strip (Jenq and Shah, 1985b). Previous studies have shown that the descending segment of the P-CMOD curve is affected by the cohesive stress distribution, while the peak load and critical crack mouth opening displacement are almost not affected (Li et al., 2012). Therefore, to simplify the analysis of the fracture processes, a linear cohesive stress assumption (m=1) was adopted for the propagation state of concrete cracks in the current study. The cohesive stress distribution is shown in Fig. 4, where σs(CTOD) is the function of CTOD.
Fig.4 Linear distribution of cohesive stress
The weight function method proposed by Kumar and Barai (2009) was adopted in this study to calculate KIC:
,
where g(a) can be expressed using the following fourth-order weight function:
,
where A1=σs(CTOD), A2=[ft−σ(CTOD)]/(a−a0), s=1−a0/a, M1, M2, and M3 can be expressed by α (Kumar and Barai, 2009).
The CTOD and σs(CTOD) values are required to calculate KIC using Eqs. (6) and (7), where σs(CTOD) can be expressed by (Reinhardt et al., 1986):
,
where c1, c2, and w0 are parameters.
CTOD in Eq. (8) needs to be calculated by adding up two displacements caused by the external load P and cohesive stress. Using Paris’ displacement formula (Tada et al., 2000; Mai, 2002), CTOD can be expressed by
,
where E is the elasticity modules, ξ is the integration variable, m(x, a) can be expressed using the following fourth-order weight function (Kumar and Barai, 2009):
.
Thus, using Eqs. (7)–(9), g(a) can be derived, and KIC can be obtained using Eq. (6). Then, substituting Eq. (4) for KIP and Eq. (6) for KIC into Eq. (2b) leads to:
,
where
Eq. (11) obviously shows that the external load P can be explicitly expressed as a function of the effective crack length a. The derivation of this equation with respect to a at the moment of the crack instability can be expressed by the following partial differential equation:
,
and is calculated by
,
where
g′(a) can be expressed as
,
where
k′(α) can be expressed as
.
If the initial toughness is given, the critical effective crack length ac can be calculated using Eq. (12) by iterating method. Then, the critical crack tip opening displacement CTODc and the peak load Pmax can be obtained by substituting a=ac into Eq. (9) and Eq. (11), respectively. The unstable toughness can be calculated by substituting a=ac and P=Pmax into Eq. (4). Hence, an analytical approach for calculating was developed.
4. Results and discussion
4.1. Verification of the analytical method
In this section, the proposed method for concrete fracture was verified using the data from Xu et al. (2006)’s experiments on WS specimens with different maximum aggregate sizes. The parameters of the specimens are shown in Table 1. In the experiments, the crack initiation load Pini was measured by resistance strain gauges and the initial toughness was obtained by the LEFM formula.
Table 1
Parameters of the wedge splitting specimens
Specimen No.
Specimen size, 2H×D×B (mm)
Maximum aggregate size (mm)
a0 (mm)
E (GPa)
Compressive strength, fc (MPa)
Tensile strength, ft (MPa)
WS13
300×300×200
20
150
33.4
34.2
2.76
WS14
600×600×200
20
300
33.4
34.2
2.76
WS15
800×800×200
20
400
33.4
34.2
2.76
WS16
1000×1000×200
20
500
33.4
34.2
2.76
WS17
1200×1200×200
20
600
33.4
34.2
2.76
WS32
300×300×200
40
150
29.1
34.3
3.04
WS22
600×600×200
40
300
29.1
34.3
3.04
WS34
800×800×200
40
400
29.1
34.3
3.04
WS35
1000×1000×200
40
500
29.1
34.3
3.04
WS23
600×600×250
80
300
29.1
34.3
3.04
WS24
800×800×250
80
400
29.1
34.3
3.04
WS25
1000×1000×250
80
500
29.1
34.3
3.04
WS26
1200×1200×250
80
600
29.1
34.3
3.04
According to the experimental conditions, the parameters in Eq. (8) for the proposed method were taken as follows: c1=3, c2=6.93, and w0=160 μm (Reinhardt et al., 1986).
The calculated and measured values of the peak load Pmax are compared in Tables 2–4. It can be seen from the comparison that the values of the peak load Pmax calculated by the proposed method are generally in good agreement with the experimental values for different maximum aggregate sizes of concrete specimens. It can be concluded that the method is effective for predicting the instability of concrete.
Table 2
Comparison of the predicted and measured results (maximum aggregate size: 20 mm)
Specimen No.
Specimen size, 2H×D×B (mm)
a0 (mm)
Pini (kN)
Predicted ac/D
Predicted Pmax (kN)
Experimental Pmax (kN)
Predicted (1)
Experimental (2)
(1)/(2)
WS13-1
300×300×200
150
7.181
0.620
11.668
12.173
1.637
1.690
0.969
WS13-2
300×300×200
150
10.916
0.567
14.156
12.801
1.642
1.958
0.838
WS13-4
300×300×200
150
7.909
0.607
12.095
11.492
1.614
1.759
0.918
Mean
8.669
0.598
12.639
12.155
1.631
1.802
0.908
WS14-1
600×600×200
300
19.308
0.569
25.387
25.550
2.098
2.224
0.943
WS14-2
600×600×200
300
18.484
0.583
24.787
22.667
2.148
2.462
0.872
WS14-4
600×600×200
300
18.000
0.583
24.437
23.408
2.117
2.004
1.057
Mean
18.597
0.578
24.870
23.875
2.121
2.230
0.957
WS15-1
800×800×200
400
23.788
0.597
32.848
30.758
2.596
2.191
1.185
WS15-2
800×800×200
400
24.546
0.584
33.387
31.136
2.511
2.135
1.176
WS15-3
800×800×200
400
17.403
0.639
28.776
29.351
2.667
2.102
1.269
Mean
21.912
0.607
31.670
30.415
2.591
2.143
1.210
WS16-1
1000×1000×200
500
32.495
0.570
42.677
42.137
2.741
2.974
0.922
WS16-2
1000×1000×200
500
30.478
0.584
41.205
39.000
2.777
2.851
0.974
WS16-3
1000×1000×200
500
24.235
0.612
36.929
31.494
2.753
2.250
1.224
Mean
29.069
0.589
40.270
37.544
2.757
2.692
1.040
WS17-1
1200×1200×200
600
33.368
0.584
46.734
46.326
2.878
3.231
0.891
WS17-2
1200×1200×200
600
36.699
0.584
49.142
55.183
3.026
3.028
0.999
WS17-3
1200×1200×200
600
40.045
0.570
51.689
50.355
3.033
3.112
0.975
Mean
36.704
0.579
49.188
50.621
2.979
3.124
0.955
Table 3
Comparison of the predicted and measured results (maximum aggregate size: 40 mm)
Specimen No.
Specimen size, 2H×D×B (mm)
a0 (mm)
Pini (kN)
Predicted ac/D
Predicted Pmax (kN)
Experimental Pmax (kN)
Predicted (1)
Experimental (2)
(1)/(2)
WS32-1
300×300×200
150
8.234
0.593
12.237
11.221
1.556
1.524
1.021
WS32-2
300×300×200
150
8.848
0.580
11.384
9.433
1.381
1.232
1.121
WS32-3
300×300×200
150
8.431
0.593
12.366
10.727
1.572
1.371
1.147
Mean
8.504
0.589
11.996
10.460
1.503
1.376
1.096
WS33-2
600×600×200
300
18.973
0.569
25.017
24.511
2.068
1.957
1.057
WS33-3
600×600×200
300
18.588
0.569
24.725
21.956
2.044
2.132
0.959
WS33-4
600×600×200
300
16.091
0.583
22.912
21.242
1.985
2.006
0.990
Mean
17.884
0.574
24.218
22.570
2.032
2.032
1.002
WS34-1
800×800×200
400
22.306
0.584
30.683
27.349
2.308
2.016
1.145
WS34-2
800×800×200
400
18.766
0.597
28.215
27.049
2.230
2.106
1.059
WS34-4
800×800×200
400
26.711
0.570
34.006
32.000
2.439
2.713
0.899
Mean
22.594
0.584
30.968
28.799
2.326
2.278
1.034
WS35-2
1000×1000×200
500
21.337
0.598
33.364
29.866
2.363
2.071
1.141
WS35-3
1000×1000×200
500
19.284
0.612
32.076
25.634
2.391
1.884
1.269
WS35-4
1000×1000×200
500
21.837
0.598
33.698
32.700
2.386
2.336
1.021
Mean
20.819
0.603
33.046
29.400
2.380
2.097
1.144
Table 4
Comparison of the predicted and measured results (maximum aggregate size: 80 mm)
Specimen No.
Specimen size, 2H×D×B (mm)
a0 (mm)
Pini (kN)
Predicted ac/D
Predicted Pmax (kN)
Experimental Pmax (kN)
Predicted (1)
Experimental (2)
(1)/(2)
WS23-2
600×600×250
300
16.525
0.638
27.138
23.407
2.312
2.465
0.938
WS23-4
600×600×250
300
17.451
0.624
27.675
24.340
2.233
2.260
0.988
Mean
16.988
0.631
27.407
23.874
2.273
2.363
0.963
WS24-1
800×800×250
400
29.425
0.584
40.357
36.833
2.429
2.867
0.847
WS24-3
800×800×250
400
31.575
0.584
41.924
35.859
2.523
2.385
1.058
WS24-4
800×800×250
400
19.594
0.639
34.058
32.178
2.525
2.766
0.913
Mean
26.865
0.602
38.780
34.957
2.492
2.673
0.939
WS25-1
1000×1000×250
500
25.000
0.626
42.102
43.711
2.649
2.814
0.941
WS25-2
1000×1000×250
500
34.093
0.584
48.006
45.163
2.588
3.043
0.850
WS25-4
1000×1000×250
500
20.590
0.640
39.637
39.194
2.636
2.308
1.142
Mean
26.561
0.617
43.248
42.689
2.624
2.722
0.978
WS26-1
1200×1200×250
600
45.168
0.570
60.206
54.000
2.826
2.931
0.964
WS26-2
1200×1200×250
600
37.663
0.598
54.773
47.340
2.836
3.326
0.853
Mean
41.416
0.584
57.490
50.670
2.831
3.129
0.909
Moreover, the values of unstable toughness are also shown in Tables 2–4. The calculated values of by the proposed method generally agree well with those by experimental method. Some of the calculated results are slightly different from those obtained by the experimental method, for example, the ratio of the predicted result to experimental result of WS15 is 1.21. According to Eq. (4), the discrepancy in the unstable toughness results from the critical relative effective crack length ac/D. The primary reason is that, as mentioned above, an empirical formula was adopted in the experimental method to calculate the critical effective length ac. The proposed method, differing from the experimental method, is capable of considering the effects of both external load and cohesive force when calculating ac.
4.2. Effect of tensile softening curve
To study the sensitivity of the method to the shape of the tensile softening curve, two groups of parameters characterizing different tensile softening curves were used to predict fracture using the proposed theoretical method.
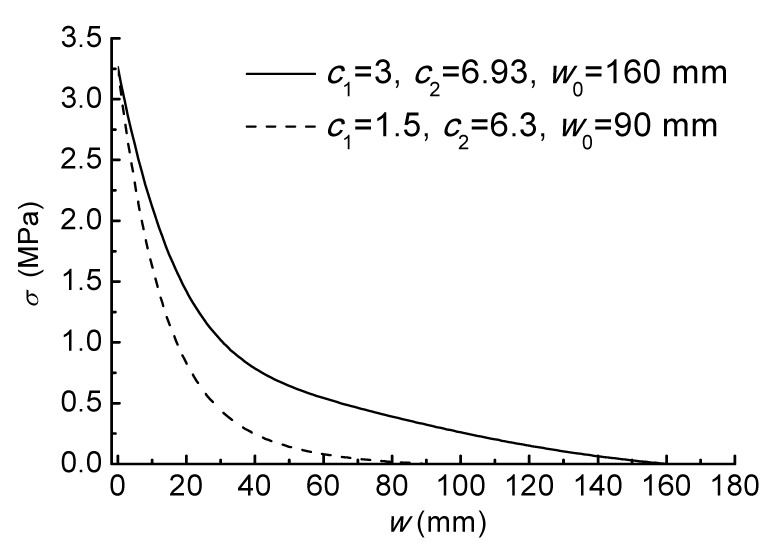
The parameters of first group were c1=3, c2=6.93, and w0=160 μm, which were adopted in the last section. For comparison, the second set of the softening curve parameters was taken as as c1=1.5, c2=6.3, and w0=90 μm. The tensile softening curves represented by these two sets of parameters are shown in Fig. 5.
Fig.5 Tensile softening curves
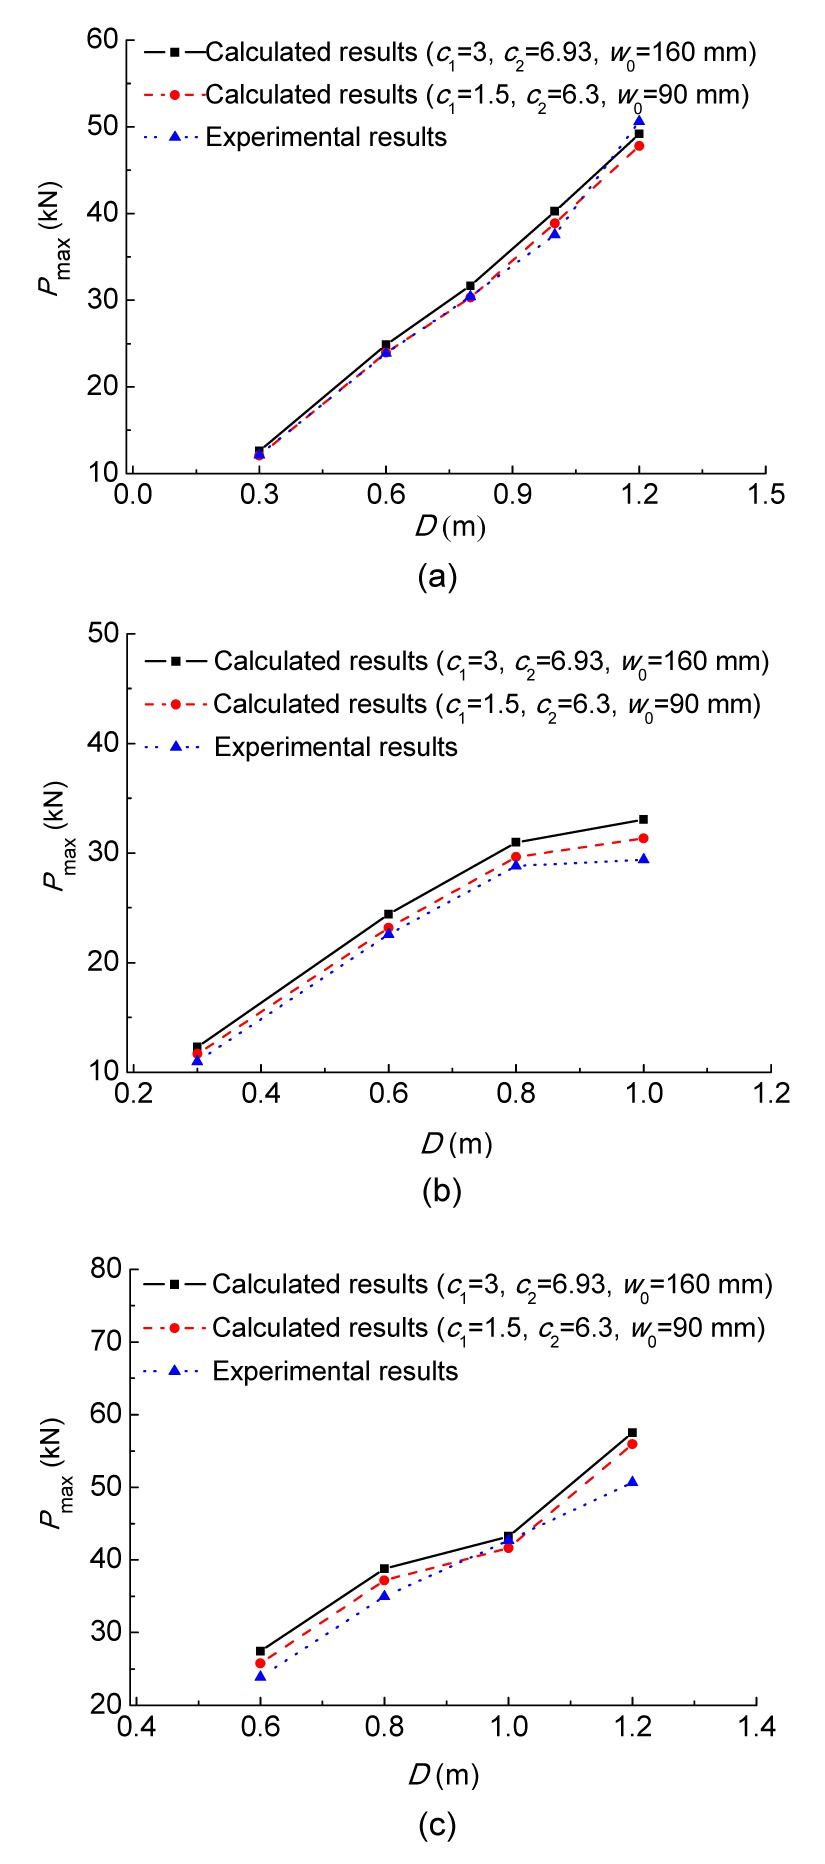
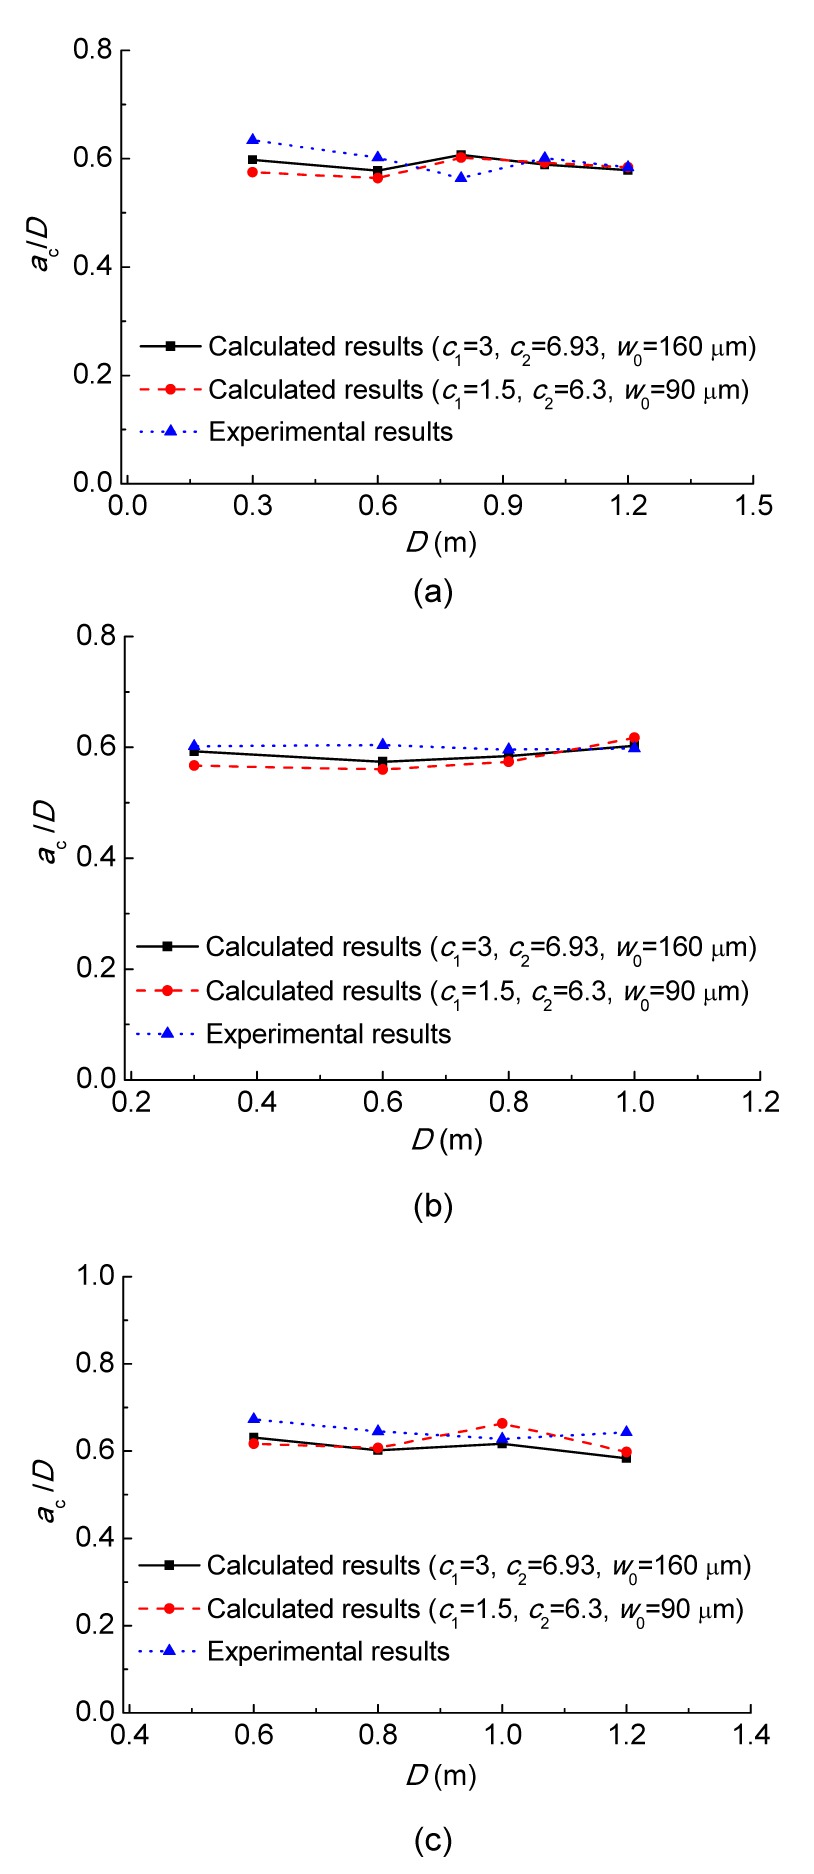
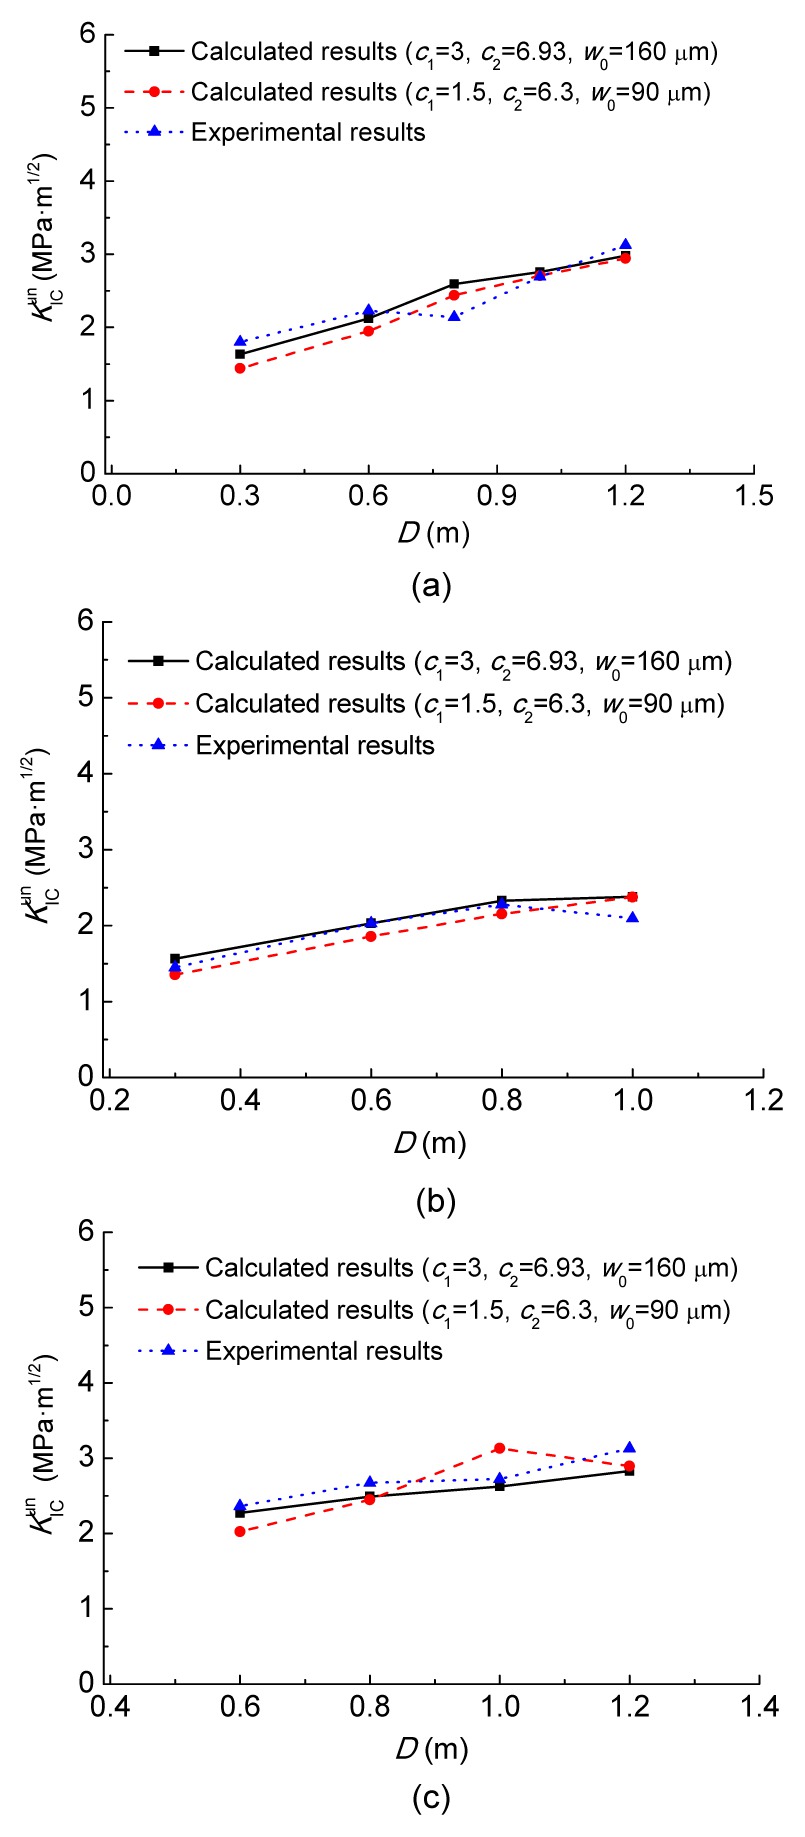
With these different parameters, the values of Pmax, ac/D, and were calculated using the proposed method, and the results are shown in Figs. 6–8. As can be seen from Figs. 6–8, the calculated Pmax, ac/D, and using the first group of parameters are slightly different from those of the other one. Generally, this disparity in the calculated results using these two sets of parameters is considered to be insignificant in view of the great difference between the two tensile softening curves. For example, the fracture energy GF (area under the tensile softening curve) corresponding to the first softening curve is about twice that for the second one.
Fig.6 Average values of Pmax for specimens with different maximum aggregate sizes of 20 mm (a), 40 mm (b), and 80 mm (c)
Fig.7 Average values of ac/D for specimens with different maximum aggregate sizes of 20 mm (a), 40 mm (b), and 80 mm (c)
Fig.8 Average values of for specimens with different maximum aggregate sizes of 20 mm (a), 40 mm (b), and 80 mm (c)
5. Conclusions
In this study, the instability state of fracture in concrete was predicted by a theoretical model which adopted the initial toughness as the crack propagation criterion, and used the weight function method to calculate the stress intensity factor and the crack opening displacement caused by the cohesive stress. The applicability of the proposed method was verified by experimental data obtained on WS specimens, and the parameters at the peak load state, such as the peak load Pmax, critical effective crack length ac and unstable toughness , were calculated using the proposed method. The good agreement between the calculated results and the experimental results demonstrates that the proposed method can accurately predict the unstable toughness . In addition, the sensitivity of the results to the tensile softening curve was discussed. The results showed that the proposed method for fracture is not sensitive to the tensile softening curve, which verifies the reasonability of the proposed method. Future studies can be conducted from many aspects, such as the investigation of measurement methods for the effective crack length ac.
[1] Bazant, Z.P., 1984. Size effect in blunt fracture: concrete, rock, metal. Journal of Engineering Mechanics, 110(4):518-535.
[2] Bazant, Z.P., Oh, B.H., 1983. Crack band theory for fracture of concrete. Material and Structure, 16(3):155-177.
[3] Bazant, Z.P., Planas, J., 1998. Fracture and Size Effect in Concrete and Other Quasibrittle Materials. CRC Press,Boca Raton :
[4] DL/T 5332-2005, 2006. Specification for Fracture Test of Hydraulic Concrete. (in Chinese), China Electric Power Press,Beijing, China :
[5] Dong, W., Wu, Z.M., Zhou, X.M., 2013. Calculating crack extension resistance of concrete based on a new crack propagation criterion. Construction and Building Materials, 38:879-889.
[6] Elices, M., Planas, J., 1991. Material models. Fracture Mechanics of Concrete Structures from Theory to Applications. Report of RILEM Technical Committee 90-FMT. Chapman & Hall,London :16-65.
[7] Hillerborg, A., Modeer, M., Petersson, P.E., 1976. Analysis of crack formation crack growth in concrete by means of fracture mechanics and finite elements. Cement and Concrete Research, 6(6):773-782.
[8] Jenq, Y.S., Shah, S.P., 1985. Two parameter fracture model for concrete. Journal of Engineering Mechanics, 111(10):1227-1241.
[9] Jenq, Y.S., Shah, S.P., 1985. A fracture toughness criterion for concrete. Engineering Fracture Mechanics, 21(5):1055-1069.
[10] Karihaloo, B.L., Nallathambi, P., 1990. Effective cracks model for the determination of fracture toughness (KICS) of concrete. Engineering Fracture Mechanics, 35(4-5):637-645.
[11] Kumar, S., Barai, S.V., 2008. Influence of specimen geometry and size-effect on the KR-curve based on the cohesive stress in concrete. International Journal of Fracture, 152(2):127-148.
[12] Kumar, S., Barai, S.V., 2009. Determining double-K fracture parameters of concrete for compact tension and wedge splitting tests using weight function. Engineering Fracture Mechanics, 76(7):935-948.
[13] Li, Q.B., Qing, L.B., Guan, J.F., 2012. Analysis of the whole fracture process of concrete considering effects of cohesive distribution. Journal of Hydraulic Engineering, (in Chinese),43(Sup.):31-36.
[14] Mai, Y.W., 2002. Cohesive zone and crack-resistance (R)-curve of cementitious materials and their fibre-reinforced composites. Engineering Fracture Mechanics, 69(2):219-234.
[15] Qing, L.B., Li, Q.B., 2013. A theoretical method for determining initiation toughness based on experimental peak load. Engineering Fracture Mechanics, 99:295-305.
[16] Reinhardt, H.W., 1985. Plain concrete modeled as an elastic strain-softening material at fracture. Engineering Fracture Mechanics, 22(5):787-796.
[17] Reinhardt, H.W., Xu, S.L., 1999. Crack extension resistance based on the cohesive force in concrete. Engineering Fracture Mechanics, 64(5):563-587.
[18] Reinhardt, H.W., Cornelissen, H.A.W., Hordijk, D.A., 1986. Tensile tests and failure analysis of concrete. Journal of Structural Engineering, 112(11):2462-2477.
[19] Tada, H., Paris, P.C., Irwin, G., 2000. The Stress Analysis of Cracks Handbook, , New York, :
[20] Wu, Z.M., Dong, W., Liu, K., Yang, S.T., 2007. Mode I crack propagation criterion of concrete and numerical simulation on complete process of cracking. Journal of Hydraulic Engineering, (in Chinese),38:46-52.
[21] Xu, S.L., Reinhardt, H.W., 1999. Determination of double-K criterion for crack propagation in quasi-brittle fracture, Part I: experimental investigation of crack propagation. International Journal of Fracture, 98(2):111-149.
[22] Xu, S.L., Reinhardt, H.W., 1999. Determination of double-K criterion for crack propagation in quasi-brittle fracture, Part II: analytical evaluating and practical measuring methods for three-point bending notched beams. International Journal of Fracture, 98(2):151-177.
[23] Xu, S.L., Reinhardt, H.W., 1999. Determination of double-K criterion for crack propagation in quasi-brittle fracture, Part III: compact tension specimens and wedge splitting specimens. International Journal of Fracture, 98(2):179-193.
[24] Xu, S.L., Reinhardt, H.W., 2000. A simplified method for determining double-K fracture parameters for three-point bending tests. International Journal of Fracture, 104(2):181-209.
[25] Xu, S.L., Zhou, H.G., Gao, H.B., Zhao, S.Y., 2006. An experimental study on double-K fracture parameters of concrete for dam construction with various grading aggregates. China Civil Engineering Journal, 39(11):50-62.
[26] Zhang, J., Leung, K.Y., Xu, S.L., 2010. Evaluation of fracture parameters of concrete from bending test using inverse analysis approach. Materials and Structure, 43(6):857-875.
[27] Zhang, X.F., Xu, S.L., 2011. A comparative study on five approaches to evaluate double-K fracture toughness parameters of concrete and size effect analysis. Engineering Fracture Mechanics, 78(10):2115-2138.
Open peer comments: Debate/Discuss/Question/Opinion


Open peer comments: Debate/Discuss/Question/Opinion
<1>