1. Introduction
The genus
Pyrus is classified in subtribe Pyrinae within tribe Pyreae of the family Rosaceae (Potter et al.,
2007), and includes approximately 22 well-recognized primary species as well as several natural or artificial interspecific hybrids (Bell and Zwet,
1998). It is a functionally diploid genus (2
n=34) of allopolyploid origin and is believed to have arisen about 55–65 million years ago in the mountainous regions of western and southwestern China (Rubtsov,
1944). However, because pears are considered to be typically self-incompatible and interspecies compatible, phylogenetic relationships within the genus
Pyrus are complicated and difficult to be established because of high heterozygosity from widespread crossing and low morphological diversity or poor differentiating characters (Teng et al.,
2002; Bao et al.,
2007; Yao et al.,
2010; Zheng et al.,
2011). Hence, more DNA-based genetic markers need to be exploited to resolve these problems.
Simple sequence repeats (SSRs) or microsatellites are one of the most efficient genetic markers. By virtue of their reproducibility, multi-allelic nature, co-dominant inheritance, relative abundance, and good genome coverage (Powell et al.,
1996), SSR markers have been largely applied to genetic diversity studies (Gupta and Varshney,
2000; Chen et al.,
2011; Zhang et al.,
2013) and used in a variety of applications related to pears, demonstrating their adaptability for
Pyrus (Yamamoto et al.,
2002;
2004; Bao et al.,
2007; Katayama et al.,
2007; Yao et al.,
2010; Cao et al.,
2012). SSR loci consist of randomly repeated DNA regions with motif lengths of one to six base pairs (bp) and are spread throughout the genome (Tóth et al.,
2000). According to their locations in the genome, SSR markers are generally divided into genomic SSRs and genic SSRs (or expressed sequence tag (EST)-SSRs); in comparison with genomic SSR markers, genic SSR markers are derived from coding regions and are believed to have some intrinsic advantages, such as inexpensiveness and relative ease of obtaining, applicability to assaying functional diversity in natural populations or germ-plasm collections, high transferability to related species, and usefulness as anchor markers for comparative mapping or evolutionary studies (Varshney et al.,
2005).
However, the development of genic SSRs can be difficult because of the laborious and costly collection of ESTs (Bouck and Vision,
2006), so few pear ESTs (about 4413, before June 7, 2013) have been submitted to GenBank and few studies on the development of EST-SSR markers from
Pyrus have been reported (Nishitani et al.,
2009). Most of the EST-SSRs used in pear genetic diversity were derived from
Malus (Yamamoto et al.,
2001; Yao et al.,
2010). With the development of the next-generation sequencing technology, creating transcriptome-level sequence collections has become much quicker and cheaper (Mardis,
2008). As a result, a wealth of gene-based SSRs and other genetic markers depending on such resources have been identified and developed in various plant species (Vendramin et al.,
2006; Blanca et al.,
2011; Dutta et al.,
2011; Kaur et al.,
2012; Lesser et al.,
2012), but have not been reported in
Pyrus.
Although a pear genome sequence was obtained with a genome size of 512 Mbp recently (Wu et al.,
2013), which provides an excellent platform for future genetic marker development and phylogenetic relationship analysis in
Pyrus, SSR markers designed from ESTs or unigenes possess higher amplification rates and cross-species transferability (Barbará et al.,
2007). Therefore, a transcriptome database offers an attractive alternative to complement existing SSR collections. In this study, we reported the first development of genic SSR markers in
Pyrus, which adds to the available resources and provides new opportunities for assessing molecular phylogeny and genetic diversity in the
Pyrus species.
2. Materials and methods
2.1. Plant materials and DNA extraction
A total of 29 accessions from
Pyrus were used in the development of the genic SSR markers in this study (Table
1). Genomic DNA was extracted from young leaves of these
Pyrus accessions using a modified version of a cetyltrimethylammonium bromide (CTAB) protocol (Doyle and Doyle,
1987). DNA quality and quantity were checked in 1% agarose gels and Eppendorf BioSpectrometer (Eppendorf, Germany), respectively.
Table 1
List of 29 Pyrus accessions used in the polymorphism analysis
| No. |
Accession |
Species |
Type |
Origin |
Leaf source |
| 1 |
‘Huiyangqingli’ |
P. pyrifolia
|
Cultivar |
Guangdong, China |
CPGR |
| 2 |
‘Huiyangsuanli’ |
P. pyrifolia
|
Cultivar |
Guangdong, China |
CPGR |
| 3 |
‘Nijisseiki’ |
P. pyrifolia
|
Cultivar |
Japan |
TU |
| 4 |
‘Imamuraaki’ |
P. pyrifolia
|
Cultivar |
Japan |
TU |
| 5 |
‘Jinchuanxueli’ |
P. pyrifolia
|
Cultivar |
Japan |
CPGR |
| 6 |
‘Manyuanxiang’ |
P. ussuriensis
|
Cultivar |
Liaoning, China |
CPGR |
| 7 |
‘Nanguoli’ |
P. ussuriensis
|
Cultivar |
Liaoning, China |
CPGR |
| 8 |
P. ussuriensis
|
P. ussuriensis
|
Wild material |
Liaoning, China |
CPGR |
| 9 |
‘Cili’ |
P. pyrifolia white pear group |
Cultivar |
Shandong, China |
CPGR |
| 10 |
‘Yali’ |
P. pyrifolia white pear group |
Cultivar |
Hebei, China |
CPGR |
| 11 |
P. pashia 1
|
P. pashia
|
Wild material |
Guizhou, China |
Guizhou |
| 12 |
P. pashia 2
|
P. pashia
|
Wild material |
Guizhou, China |
Guizhou |
| 13 |
P. pashia 3
|
P. pashia
|
Wild material |
Nepal |
TU |
| 14 |
P. dimorphophylla
|
P. dimorphophylla
|
Wild material |
Japan |
TU |
| 15 |
P. fauriei
|
P. fauriei
|
Wild material |
Korean |
TU |
| 16 |
P. betulaefolia 3
|
P. betulaefolia
|
Wild material |
Japan |
TU |
| 17 |
P. betulaefolia 1
|
P. betulaefolia
|
Wild material |
Lanzhou, China |
CPGR |
| 18 |
P. betulaefolia 2
|
P. betulaefolia
|
Wild material |
Linwu, China |
CPGR |
| 19 |
P. serrulata
|
P. serrulata
|
Wild material |
Hebei, China |
CPGR |
| 20 |
P. hopeiensis
|
P. hopeiensis
|
Wild material |
Hebei, China |
Hebei |
| 21 |
P. phaeocarpa
|
P. phaeocarpa
|
Wild material |
North of China |
CPGR |
| 22 |
P. xerophila
|
P. xerophila
|
Wild material |
Lanzhou, China |
GPI |
| 23 |
P. hondoensis
|
P. hondoensis
|
Wild material |
Center of Japan |
TU |
| 24 |
P. pyrifolia
|
P. pyrifolia
|
Wild material |
Japan |
TU |
| 25 |
P. nivalis
|
P. nivalis
|
Wild material |
Europe |
TU |
| 26 |
P. longipes
|
P. longipes
|
Wild material |
Europe |
TU |
| 27 |
P. amygdaliformis
|
P. amygdaliformis
|
Wild material |
Mediterranean, South Europe |
TU |
| 28 |
P. elaegrifolia
|
P. elaegrifolia
|
Wild material |
Turkey, South Europe, Crimean Peninsula |
TU |
| 29 |
P. communis
|
P. communis
|
Wild material |
Europe |
TU |
CPGR: China Pear Germplasm Repository; TU: Tottori University; GPI: Gansu Pomology Institute
2.2. Identification of SSR loci from the pear bud transcriptome
A total of 116 282 unigenes were obtained from the ‘Suli’ pear (
Pyrus pyrifolia white pear group) bud transcriptome in a previous study (Liu et al.,
2012). Genic SSR loci in this pear bud transcriptome were identified from the unigene set by MIcroSAtellite identification tool (MISA) (Thiel et al.,
2003), which is based on the Perl language. The SSR loci containing repeat units of 2–6 nucleotides were identified, and the minimum SSR length criteria were defined as six iterations for dinucleotide repeats, and five iterations for other repeat units.
2.3. Primer design and polymorphism testing of SSR loci
BatchPrimer3 interface modules (You et al.,
2008) were used to construct polymerase chain reaction (PCR) primers in the flanking regions of the SSR loci. The screening strategies for primer pairs were set as follows: 18–22 bp with an optimum size of 20 bp for the length of the primers, 60 °C for annealing temperature, 100–280 bp for the size of PCR products, and 40%–60% with an optimum of 50% for the guanine-cytosine (GC) content. Other parameters were at the default setting of the software. Three primer pairs were designed for each SSR locus, and the primer pair with the highest score was chosen as the best one.
Primers for compound SSR types were excluded. According to the length variation analysis of microsatellites in rice, all primers with a repeat length ≥15 bp were selected, a large proportion of which are the type I SSR markers (repeat length ≥20 bp), deemed to have a high chance of showing polymorphism (Singh et al.,
2010). A subset of 343 primers without more than four continuous single base repeats in the primer pairs was synthesized and tested for amplification. An economic method for fluorescent labeling of PCR fragments was adopted to test their polymorphism (Schuelke,
2000). A tail (M13 universal sequence, TGTAAAACGACGGCCAGT) was added to the 5' end of each of the 343 forward primers. The primers were synthesized by Invitrogen Trading (Shanghai) Co., Ltd. Four
Pyrus accessions, ‘Huiyangqingli’, ‘Huiyangsuanli’,
P.
ussuriensis, and
P. communis, were used to test the 343 SSR markers to confirm their amplification and polymorphism. The tail primers were labeled with the following four dyes: FAM (blue), HEX (green), NED (yellow), and PET (red). FAM-tail and HEX-tail were synthesized by Invitrogen Trading (Shanghai) Co., Ltd.; NED-tail and PET-tail by Applied Biosystems (Foster City, CA, USA).
2.4. PCR and polymorphic marker validation
PCR was carried out in a final reaction volume of 20 μl, containing 20–30 ng total genomic DNA, 10× PCR buffer, 1.0 mmol/L Mg
2+, 0.2 mmol/L of each dNTP, 5 pmol of each reverse primer, 4 pmol of the tail primer, 1 pmol of the forward primer, and 0.5 U Taq DNA polymerase (Sangon Biotech, Shanghai, China). Every primer’s amplification program contained two stages: after 5 min initial denaturation at 94 °C, 32 cycles were run for 30 s at 94 °C, 30 s at 58 °C and 30 s at 72 °C, followed by 8 cycles for 30 s at 94 °C, 30 s at 53 °C and 30 s at 72 °C. PCR products were electrophoresed on 3% agarose gels at 5 V/cm and stained with ethidium bromide to check their quality. Two independent PCRs were performed to confirm stable amplification.
The primers were divided into four subsets based on their product sizes, and then amplified with the four fluorescent tail primers using the same reaction volume. The PCR products with different fluorescent tails were diluted, then mixed with the internal size standard LIZ500, and loaded onto an ABI 3130 genetic analyzer (Applied Biosystems, Foster City, CA, USA). The sizes of fragments and alleles were calculated using GeneMapper version 4.0 (Applied Biosystems, Foster City, CA, USA).
Twenty-eight SSR markers were randomly selected from the polymorphic markers to validate genetic diversity in 28
Pyrus accessions, using the same PCR program and scoring approach. Several primers were separately amplified twice to confirm the veracity of scoring. The occurrences of null alleles at each locus were checked using MICROCHECKER 2.2.3 software (van Oosterhout et al.,
2004). POPGENE version 1.32 (Yeh and Boyle,
1997) was used to calculate the frequency of the major genotypes (
A), the number of genotypes (
N
g), the number of alleles (
N
a), observed heterozygosity (
H
o), and expected heterozygosity (
H
e). PowerMarker version 3.25 (Liu and Muse,
2005) was used to test for polymorphism information content (PIC). Freetree.0.9.1.50 (Pavlicek et al.,
1999) was used to construct a dendrogram using UPGMA (unweighted pair-group method with arithmetic average) cluster analysis based on Nei’s genetic identity (Nei,
1973), and the confidence of the branch support was evaluated by bootstrap analysis with 1000 replicates.
3. Results and discussion
3.1. Frequency and distribution of genic SSRs in the pear bud transcriptome
A total of 8375 SSR loci containing 2–6 bp repeat motifs were discovered from the ‘Suli’ pear bud transcriptome, representing 7.2% of the total unigenes. This frequency was a little lower than that for the EST-SSRs reported in
Malus (Yao et al.,
2010), but similar to the 7.0% and 7.6% for transcriptome genic SSRs from the
Capsicum annuum (Ashrafi et al.,
2012) and
Cajanus cajan (Dutta et al.,
2011), respectively. The differences between these results could be due to different identification criteria for the SSR loci. The SSR loci were distributed in 6521 (5.61%) unigenes, of which 5055 (76.03%) possessed a single SSR locus, 1466 (22.48%) contained more than one SSR, and 858 had compound SSRs (13.16%).
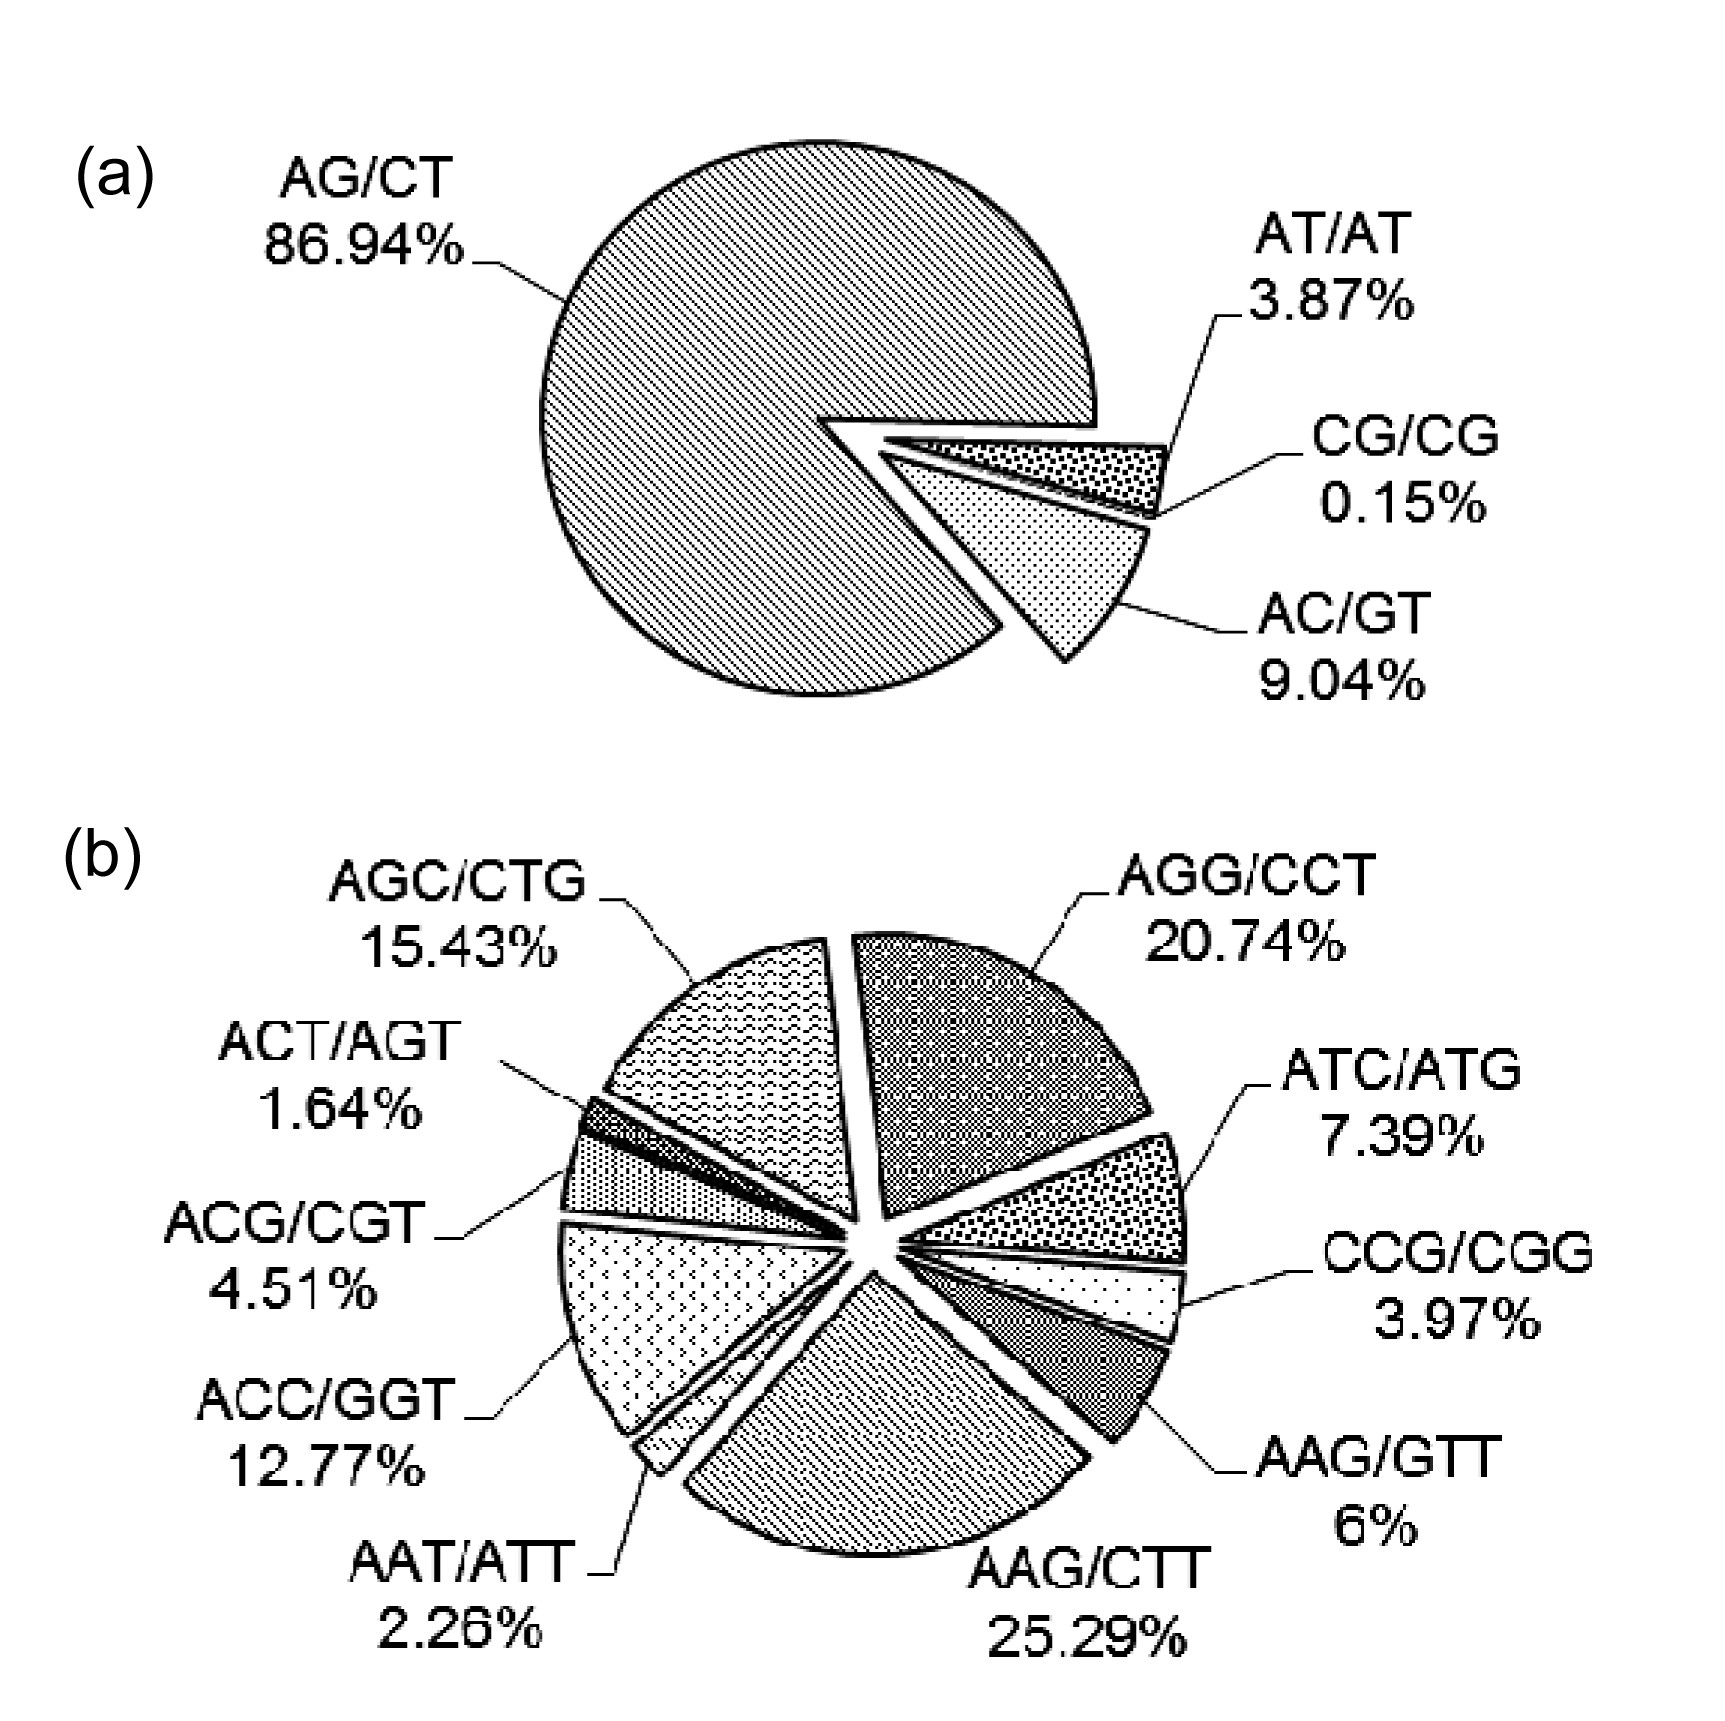
Repeat motifs among these SSR loci consisted of 64 types (considering sequence complementarity), and the number of iterations of a given repeat unit varied from 5 to 18. Incidences of different repeat types and frequencies for each motif were evaluated based on the repeat unit number (Table
2). The most abundant motif was dinucleotide (65.11%), consistent with our observations of
Pyrus EST-SSRs (Nishitani et al.,
2009), followed by trinucleotide (32.81%). The most common class was
n=6 (27.20%), containing mostly dinucleotide repeats. AG/CT comprised 86.94% of all dinucleotide motifs and was the most common type (Fig.
1a), similar to our analysis of EST-SSRs (Kantety et al.,
2002; Yao et al.,
2010). This is probably because the AG/CT dinucleotide motif can represent multiple codons resting within the reading frame that can be translated into different amino acids, and AG/CT could be present in the codons of Ala and Leu, which have the highest frequency in proteins (Yao et al.,
2010). The predominant trinucleotide repeat motifs were AAG/CTT and AGG/CCT, which accounted for 25.29% and 20.74%, respectively (Fig.
1b).
Table 2
Frequencies of different SSR repeat motif types observed in the ‘Suli’ pear bud transcriptome
| SSR motif |
Repeat number
|
Percentage (%) |
| 5 |
6 |
7 |
8 |
9 |
10 |
11 |
>11 |
Total |
| Dinucleotide |
0 |
1532 |
994 |
888 |
1073 |
782 |
173 |
11 |
5453 |
65.11 |
| Trinucleotide |
1637 |
709 |
344 |
38 |
15 |
0 |
2 |
3 |
2748 |
32.81 |
| Tetranucleotide |
106 |
33 |
0 |
3 |
0 |
0 |
0 |
1 |
143 |
1.71 |
| Pentanucleotide |
18 |
1 |
0 |
0 |
0 |
0 |
0 |
0 |
19 |
0.22 |
| Hexanucleotide |
7 |
3 |
1 |
1 |
0 |
0 |
0 |
0 |
12 |
0.14 |
| Total |
1768 |
2278 |
1339 |
930 |
1088 |
782 |
175 |
15 |
8375 |
100.00 |
|
| Percentage (%) |
21.11 |
27.20 |
15.99 |
11.10 |
12.99 |
9.34 |
2.09 |
0.17 |
100.00 |
Fig.1
Percentages of different motifs among dinucleotide (a) and trinucleotide (b) repeats in the ‘Suli’ pear bud transcriptome
3.2. Development of genic SSR markers and polymorphism detection
Of the 8375 SSR loci, primer pairs were successfully designed for 4100 loci. A total of 343 primer pairs, including 184 (53.64%) for dinucleotide repeats, 147 (42.86%) for trinucleotide repeats, 6 (1.75%) for tetranucleotide repeats, 5 (1.46%) for pentanucleotide repeats, and 1 (0.29%) for a hexanucleotide repeat, were synthesized to amplify SSRs in four
Pyrus accessions. Stable amplification of products of expected size was confirmed for 152 SSR primer pairs (44.31% of tested SSR primer pairs) in the preliminary test, a success rate comparable to 48.5% for
Saccharum (Cordeiro et al.,
2001), but lower than 92.2% for
Linum usitatissimum (Cloutier et al.,
2009) and 80.0% for
Cajanus cajan (Dutta et al.,
2011). The lack of amplification could be because some flanking primer pairs were designed across a splice site or chimeric cDNA sequence (Varshney et al.,
2006). Although the primer pairs were designed with an annealing temperature of 60 °C, the majority were amplified at 58 °C to maximize the availability of genic markers for
Pyrus.
Polymorphism was confirmed for 104 SSR markers (Table
S1) with PCR products ranging from 110 to 270 bp. The polymorphic ratio was 68.42% (104/152), which was higher than 51.09% for Pinus (Lesser et al., 2012) and 29.6% for Vicia faba (Kaur et al., 2012), probably because the type I genic SSRs showed a high level of polymorphism or because of high heterozygosity in the Pyrus (Wu et al., 2013). Dinucleotide and trinucleotide motifs represented 97.11% (101/104) of the polymorphic SSRs, which was in agreement with higher-order repeat motifs being less polymorphic than lower-order repeats (Dreisigacker et al., 2004). In addition, no AT/TA was found among these polymorphic markers; AT/TA is not usually used to develop markers because its self-complementary nature leads to the formation of dimers (Wang et al., 2011).
3.3. Functional annotation for SSR-containing unigene sequences
All SSR-containing unigene sequences were used for searching homology proteins in the National Central for Biotechnology Information (NCBI) database. Only 47.9% of the unigene sequences containing SSR loci were BLAST-annotated in the previous transcriptome analysis. This may be because the transcriptome unigenes were sequenced directly instead of after cloning, which makes new rare transcript discovery easier (Wang et al., 2009). Among these polymorphic SSR loci, 47.12% of the SSR-containing unigene sequences showed significant hits in the NCBI non-redundant protein database, and their putative functions were mostly correlated with specific biological activities (Table S1). For example, the unigene sequence containing the TXY86 SSR locus was similar to the gene of farnesyl pyrophosphate synthase (FPPS), a key branch-point enzyme in the mevalonate pathway, which is involved in the syntheses of cytokinins, abscisic acid, and gibberellins required in essential biological processes (Reilly et al., 2002). These markers with particular significance can be further applied in molecular breeding to facilitate genetic improvement of the pear.
3.4. Assessment of the genetic relationship among 28 Pyrus accessions by genic SSR markers
The applicability of the polymorphic genic SSR markers in Pyrus was validated in 28 accessions (Table 3). The PCR product sizes of the 28 genic SSR markers were 102–268 bp, and corresponded to the expected sizes for each primer. The number of alleles detected at these 28 loci ranged from 2 to 17 with an average of 9.42 alleles per locus. The observed heterozygosity at the different loci ranged from 0.14 (TXY16) to 0.89 (TXY104) with a mean of 0.49, which was lower than 0.63 reported in genomic SSR marker analysis in Pyrus (Kimura et al., 2002; Bao et al., 2007), consistent with the expectation that gene-based SSRs developed from transcribed regions are less polymorphic than genome-derived SSRs. However, this was similar to values of 0.44 for Malus EST-SSRs in European pears (Wünsch and Hormaza, 2007) and 0.48 for Pyrus EST-SSRs in identification of European and Asian pears (Bassil and Postman, 2010). Another important index of the level of polymorphism, PIC values, displayed high polymorphism at each locus, ranging from 0.26 to 0.91 with an average of 0.75.
Table 3
Characteristics of the 28 polymorphic SSR markers validated in 28 Pyrus accessions
| Locus |
Repeat motif |
Primer sequence (5'–3') |
Size range (bp) |
A
|
N
g
|
N
a
|
H
o
|
H
e
|
PIC |
| XY121 |
(CT)8
|
F: ACTGCTTGTAACACCCAACG; R: CGGAGTCAGTTGGATATCGG |
102–158 |
0.3333 |
25 |
16 |
0.6071 |
0.8714 |
0.8460 |
| TXY86 |
(AG)8
|
F: TTGGGTCTTTAAATGCCAGC; R: CCAGACGTGAGTTGTTGCC |
114–156 |
0.1667 |
28 |
17 |
0.8214 |
0.9318 |
0.9091 |
| TXY170 |
(CAT)9
|
F: TGCCTTTCCATTCTCAGGTC; R: AAGCGGCTGTCTAAATGAACA |
104–144 |
0.3611 |
17 |
8 |
0.6071 |
0.7571 |
0.7095 |
| TXY88 |
(AG)8
|
F: GAGGGAGAGAGGAAGCCATT; R: CACAAGCTTTGTATTCGGCA |
110–150 |
0.3472 |
18 |
11 |
0.4286 |
0.8123 |
0.7730 |
| TXY5 |
(TG)8
|
F: GGAGCAATGTGTGTTGTCACT; R: CCTTGCGATCGATAATTTCC |
118–146 |
0.2222 |
22 |
9 |
0.4643 |
0.8766 |
0.8459 |
| TXY276 |
(CAGCT)5
|
F: CCCTACAGAGTCATGCATCC; R: TTGATGCTGGAGACGAGAAA |
119–144 |
0.5714 |
12 |
6 |
0.4074 |
0.6408 |
0.5882 |
| TXY11 |
(TC)8
|
F: CAGAATTCAACATTCACTCTCTCTC; R: GAGTAGGGATGTGTCGGCTC |
120–166 |
0.3235 |
13 |
9 |
0.2692 |
0.8228 |
0.7814 |
| TXY15 |
(TC)8
|
F: CAGGCTAGGGTTCAGGGTTT; R: CCTTTGAAGCCAAAGACTCG |
146–184 |
0.2500 |
23 |
14 |
0.6429 |
0.8565 |
0.8250 |
| TXY102 |
(AC)8
|
F: CTCTTAACCCTCTCTCCCCC; R: CCCGATGACTCTTGAATGGT |
159–183 |
0.2639 |
21 |
12 |
0.5000 |
0.8532 |
0.8204 |
| TXY16 |
(TC)8
|
F: TTGCTGAAGCTTCTCTTCTTCTC; R: GAGCCCACAAGGGTTCAATA |
160–210 |
0.2500 |
19 |
8 |
0.1429 |
0.7766 |
0.7362 |
| TXY267 |
(TC)9
|
F: GTCTTAGCTTCTGCTCCCGA; R: AACCTGATGAGAATGACGGG |
149–195 |
0.1944 |
21 |
12 |
0.4286 |
0.8909 |
0.8625 |
| TXY63 |
(CT)8
|
F: ACCTGTCATCACTTCTACTGGTTA; R: AGCCTACAAACATGCATCCC |
169–189 |
0.1944 |
24 |
11 |
0.4643 |
0.8903 |
0.8623 |
| TXY94 |
(AG)8
|
F: ACACGCGCACACAGAGATAC; R: CCGTCACGTCGCTTTCTT |
172–206 |
0.2083 |
26 |
14 |
0.5000 |
0.8961 |
0.8689 |
| TXY95 |
(AG)8
|
F: TACGGACAAGGACACCATGA; R: CTTGACGGTGTCAAAGGGAT |
177–205 |
0.4028 |
14 |
10 |
0.5000 |
0.7721 |
0.7240 |
| TXY236 |
(TCC)6
|
F: TCCACTCCAAACCCAGAAAC; R: GCTTCAGGGAAGCTGAAATG |
183–189 |
0.7571 |
4 |
2 |
0.2222 |
0.3075 |
0.2562 |
| TXY185 |
(CAG)7
|
F: GGAGGACCAACAGCAACATT; R: AGCAAGATCAAGCCAGGTGT |
181–196 |
0.3889 |
11 |
6 |
0.4643 |
0.7682 |
0.7134 |
| TXY2 |
(AC)9
|
F: ACGCTTCAGGTTTGGACTTC; R: TCAACCTGGACCATACATTCA |
172–206 |
0.2083 |
22 |
10 |
0.5714 |
0.8656 |
0.8325 |
| TXY280 |
(AAGG)5
|
F: CGTCCAAACTCCTCAGCTTC; R: CTCTGTCTGTCTGGTCGGGT |
187–215 |
0.2778 |
17 |
8 |
0.6786 |
0.8253 |
0.7845 |
| TXY150 |
(TC)9
|
F: GCCTTGGGCTTCTTCTTCTT; R: TCGTCGTGTGATTCGACTTC |
190–216 |
0.4583 |
14 |
8 |
0.3929 |
0.7370 |
0.6898 |
| TXY219 |
(GTG)6
|
F: CTAAGAAGCCGTTCCGATGA; R: GTCTCCCATCCTCCTCTTCC |
194–218 |
0.5556 |
11 |
7 |
0.3929 |
0.6792 |
0.6304 |
| TXY45 |
(GA)8
|
F: CAGACCCCAATTCAACGTCT; R: TCTTCTGGACATGGAGGACC |
184–230 |
0.4167 |
14 |
7 |
0.5000 |
0.7409 |
0.6956 |
| TXY214 |
(ACC)6
|
F: AACCTAAACGCATTGCAACC; R: AAGATGTGAAACCGAAACCG |
202–235 |
0.2361 |
16 |
9 |
0.8214 |
0.8474 |
0.8109 |
| TXY25 |
(TC)8
|
F: TCGATTCGATCAGGTGCTAA; R: CCGTCTCTCTTTCTCCGTTG |
145–235 |
0.3194 |
18 |
10 |
0.3929 |
0.7773 |
0.7338 |
| TXY138 |
(GCC)6
|
F: AGCATTTCCGCTGTCAGAAT; R: ATGAAGTCGTCCAGAGCGTT |
218–230 |
0.3750 |
11 |
5 |
0.5357 |
0.7565 |
0.7014 |
| TXY48 |
(GA)8
|
F: ACTAGGCAAACCAATCCAGC; R: TTGGGATCTTGTGAAGAGGG |
221–245 |
0.4032 |
13 |
8 |
0.2500 |
0.7385 |
0.6923 |
| TXY144 |
(GAG)11
|
F: ACGGAGAAGAAGCAGCAGAG; R: ACAATCTCATCCTCAACGCC |
216–228 |
0.5161 |
8 |
5 |
0.1667 |
0.7048 |
0.6490 |
| TXY104 |
(AC)8
|
F: CCCTTGATACTCAAACCCTCC; R: GATCGTTCCTTCACCAGCAT |
238–270 |
0.3286 |
17 |
13 |
0.8889 |
0.8519 |
0.8204 |
| TXY164 |
(TGC)5
|
F: CACACGAATAGCTCCTGCAA; R: AGCATCAGCAACAGCAACAG |
241–268 |
0.2917 |
16 |
9 |
0.6071 |
0.8279 |
0.7903 |
| Mean |
|
|
|
0.3437 |
16.96 |
9.429 |
0.4882 |
0.7884 |
0.7483 |
<FAM>, <HEX>, <NED>, and <PET> represent four different fluorescent labels; <Tail> represents the M13 universal primer (TGTAAAACG ACGGCCAGT) added to the 5' end of forward primers. Shown for each primer pair are the repeat motif, primer sequence, size range (bp), major allele frequency (A), number of genotypes (N
g), number of alleles (N
a), observed heterozygosity (H
o), expected heterozygosity (H
e), and polymorphism information content (PIC)
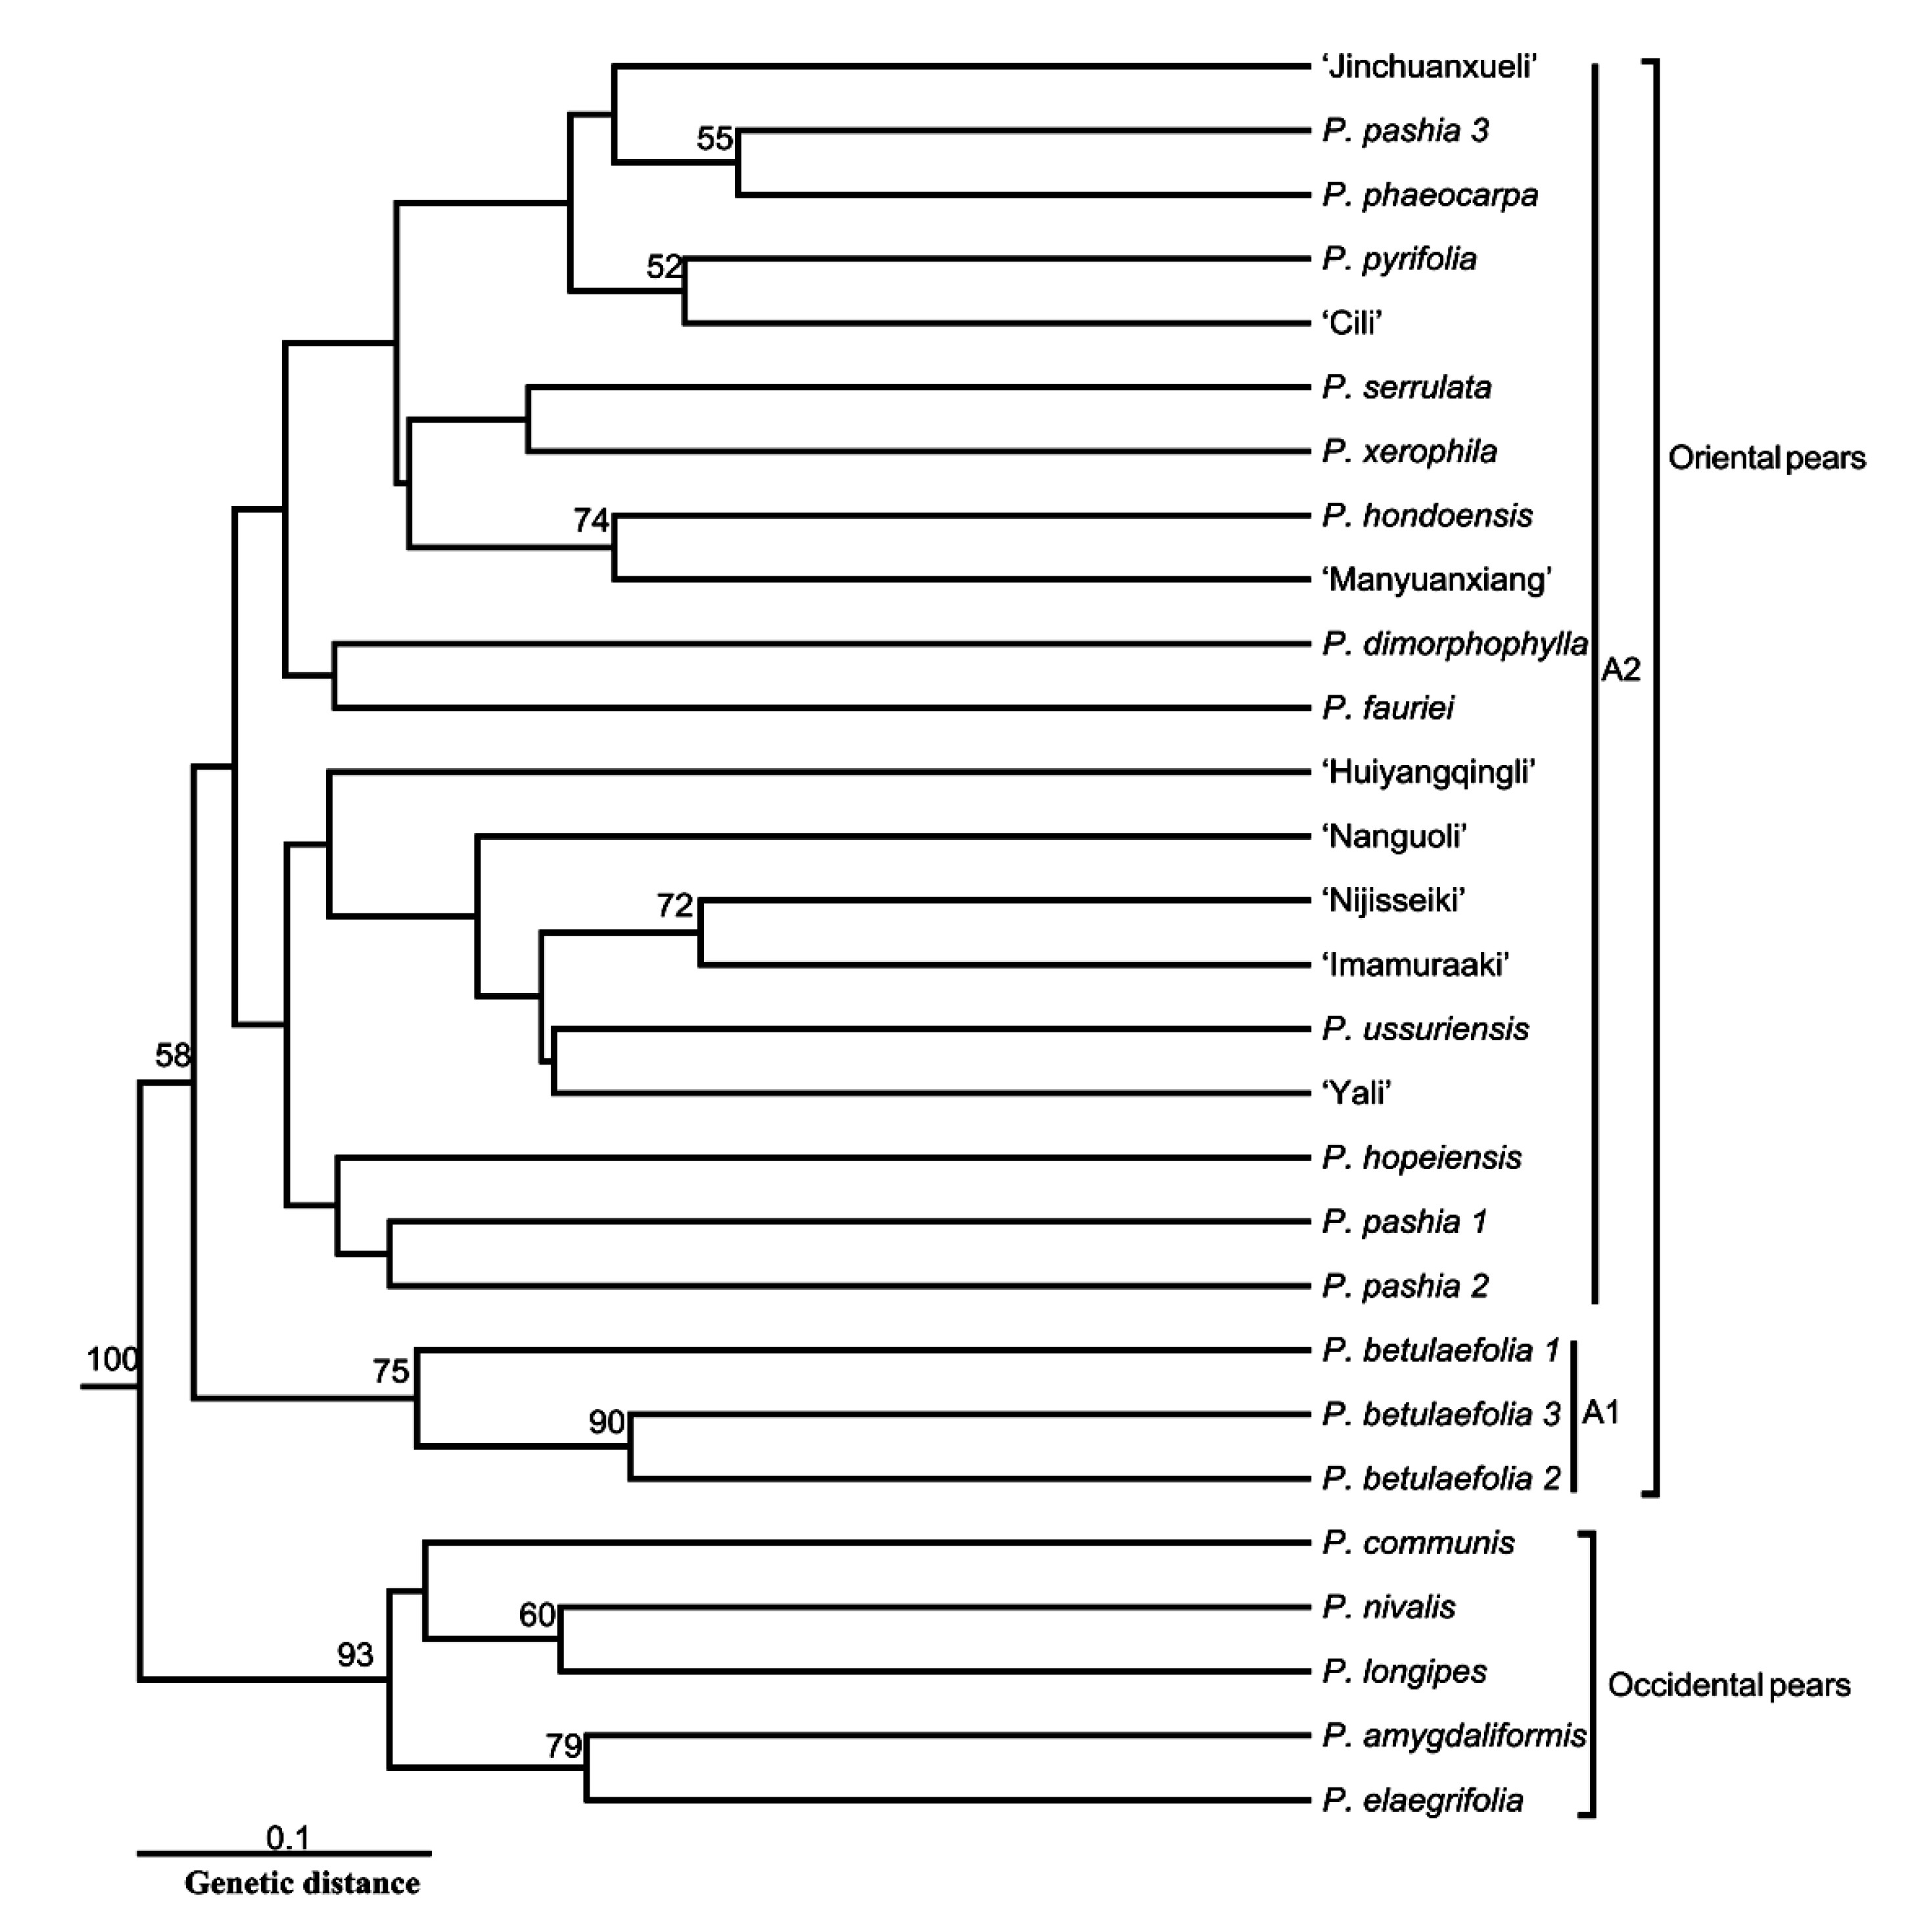
The UPGMA cluster analysis divided the 28 Pyrus accessions into two groups, Oriental pears and Occidental pears, with a 100% confidence coefficient (Fig. 2), which was similar to many previous related studies (Teng and Tanabe, 2004; Bao et al., 2007; Yao et al., 2010), demonstrating the applicability of genic SSRs from transcriptomic unigenes in Pyrus.
Fig.2
Dendrogram for 28 Pyrus accessions derived from UPGMA analysis of 28 highly polymorphic SSR markers
The numbers are bootstrap values based on 1000 iterations; only values larger than 50 are included
In addition, the Oriental pear cluster contained two subgroups: A1, consisting of three P. betulifolia accessions, and A2, which clustered the other cultivars and species together. The position of P. betulifolia at the first independent branch in the Oriental pears might be related to its older origin (Zheng et al., 2011), which was confirmed by recent phylogenetic research from our research group (unpublished data). The species and cultivars in A2 displayed a complex relationship with a lower confidence coefficient, probably due to wide hybridization within Pyrus (Aldasoro et al., 1996). Some species of unknown or controversial origin were also included in this validation experiment, such as P. hopeiensis and P. phaeocarpa. P. hopeiensis was grouped together with P. pashia, and P. phaeocarpa clustered with P. serrulata, indicating their hybrid origins (Zheng et al., 2011). In addition, P. ussuriensis and ‘Yali’ formed a branch in agreement with Yao (2010). ‘Cili’, another cultivar from the P. pyrifolia white pear group, clustered with P. pyrifolia from Japan, which supports the viewpoint that Chinese white pears are a variety or ecotype of P. pyrifolia (P. pyrifolia white pear group) (Teng and Tanabe, 2004; Bao et al., 2007; Zheng et al., 2011).
These polymorphic gene-based SSR markers can be used to support germ-plasm enhancement, population structure, and genetic diversity to understand the genetic architecture of important agronomic traits in Pyrus, or transferred to other species in the subfamily for further research. In addition, these polymorphic SSR loci located in SSR-containing unigene sequences with putative special functions can be combined with phenotypic data to extend their applications in germ-plasm evaluation and examining the functional diversity at a certain locus.
4. Conclusions
This is the first report of genic SSR marker development in Pyrus from transcriptomic unigenes by next generation deep sequencing technology. A total of 8375 genic SSR loci were discovered from transcriptomic unigenes and a set of 104 (30.3% in 343) genic SSR markers were developed to enrich rare Pyrus EST-SSRs and provide additional tools for genetic analysis in the genus Pyrus. Twenty-eight polymorphic loci were further validated in 28 accessions and showed high polymorphism, demonstrating their effectiveness in analyzing Pyrus genetic relationships and confirming the potential value of a pear transcriptome database for the development of new SSR markers.
* Project supported by the National Natural Science Foundation of China (No. 31201592), the Modern Agro-industry Technology Research System (No. nycytx-29-14), and the Doctoral Program of Higher Education (No. 20110101110091), China# Electronic supplementary materials: The online version of this article (http://dx.doi.org/10.1631/jzus.B1300240) contains supplementary materials, which are available to authorized usersCompliance with ethics guidelines Xiao-yan YUE, Guo-qin LIU, Yu ZONG, Yuan-wen TENG, and Dan-ying CAI declare that they have no conflict of interest.
References
[1] Aldasoro, J.J., Aedo, C., Garmendia, F.M., 1996. The genus
Pyrus L. (Rosaceae) in south-west Europe and North Africa.
Bot J Linn Soc, 121(2):143-158.

[2] Ashrafi, H., Hill, T., Stoffel, K., 2012. De novo assembly of the pepper transcriptome (
Capsicum annuum): a benchmark for in silico discovery of SNPs, SSRs and candidate genes.
BMC Genomics, 13(1):571

[3] Bao, L., Chen, K., Zhang, D., 2007. Genetic diversity and similarity of pear (
Pyrus L.) cultivars native to East Asia revealed by SSR (simple sequence repeat) markers.
Genet Resour Crop Ev, 54(5):959-971.
[4] Barbar, T., Palma-Silva, C., Paggi, G.M., 2007. Cross-species transfer of nuclear microsatellite markers: potential and limitations.
Mol Ecol, 16(18):3759-3767.
[5] Bassil, N., Postman, J.D., 2010. Identification of European and Asian pears using EST-SSRs from
Pyrus
.
Genet Resour Crop Ev, 57(3):357-370.
[6] Bell, R.L., Zwet, T., 1998. Breeding for host resistance to pear psylla: evaluation of parental germplasm.
Acta Hortic (ISHS), 484:471-476.
[7] Blanca, J., Cañizares, J., Roig, C., 2011. Transcriptome characterization and high throughput SSRs and SNPs discovery in
Cucurbita pepo (Cucurbitaceae).
BMC Genomics, 12(1):104
[8] Bouck, A., Vision, T., 2006. The molecular ecologist’s guide to expressed sequence tags.
Mol Ecol, 16(5):907-924.
[9] Cao, Y., Tian, L., Gao, Y., 2012. Genetic diversity of cultivated and wild Ussurian Pear (
Pyrus ussuriensis Maxim.) in China evaluated with M13-tailed SSR markers.
Genet Resour Crop Ev, 59(1):9-17.
[10] Chen, X., Sun, D., Rong, D., 2011. A recessive gene controlling male sterility sensitive to short daylength/low temperature in wheat (
Triticum aestivum L.).
J Zhejiang Univ-Sci B (Biomed & Biotechnol), 12(11):943-950.
[11] Cloutier, S., Niu, Z., Datla, R., 2009. Development and analysis of EST-SSRs for flax (
Linum usitatissimum L.).
Theor Appl Genet, 119(1):53-63.
[12] Cordeiro, G.M., Casu, R., McIntyre, C.L., 2001. Microsatellite markers from sugarcane (
Saccharum spp.) ESTs cross transferable to erianthus and sorghum.
Plant Sci, 160(6):1115-1123.
[13] Doyle, J., Doyle, J., 1987. Genomic plant DNA preparation from fresh tissue-CTAB method.
Phytochem Bull, 19(11):11-15.
[14] Dreisigacker, S., Zhang, P., Warburton, M.L., 2004. SSR and pedigree analyses of genetic diversity among CIMMYT wheat lines targeted to different megaenvironments.
Crop Sci, 44(2):381-388.
[15] Dutta, S., Kumawat, G., Singh, B.P., 2011. Development of genic-SSR markers by deep transcriptome sequencing in pigeonpea [
Cajanus cajan (L.) Millspaugh].
BMC Plant Biol, 11(1):17
[16] Gupta, P., Varshney, R., 2000. The development and use of microsatellite markers for genetic analysis and plant breeding with emphasis on bread wheat.
Euphytica, 113(3):163-185.
[17] Kantety, R.V., La Rota, M., Matthews, D.E., 2002. Data mining for simple sequence repeats in expressed sequence tags from barley, maize, rice, sorghum and wheat.
Plant Mol Biol, 48(5-6):501-510.
[18] Katayama, H., Adachi, S., Yamamoto, T., 2007. A wide range of genetic diversity in pear (
Pyrus ussuriensis var.
aromatica) genetic resources from Iwate, Japan revealed by SSR and chloroplast DNA markers.
Genet Resour Crop Ev, 54(7):1573-1585.
[19] Kaur, S., Pembleton, L.W., Cogan, N.O., 2012. Transcriptome sequencing of field pea and faba bean for discovery and validation of SSR genetic markers.
BMC Genomics, 13(1):104
[20] Kimura, T., Shi, Y.Z., Shoda, M., 2002. Identification of Asian pear varieties by SSR analysis.
Breed Sci, 52(2):115-121.
[21] Lesser, M.R., Parchman, T., Buerkle, C., 2012. Cross-species transferability of SSR loci developed from transcriptome sequencing in lodgepole pine.
Mol Ecol Resour, 12(3):448-455.
[22] Liu, G., Li, W., Zheng, P., 2012. Transcriptomic analysis of ‘Suli’ pear (
Pyrus pyrifolia white pear group) buds during the dormancy by RNA-Seq.
BMC Genomics, 13(1):700
[23] Liu, K., Muse, S.V., 2005. PowerMarker: an integrated analysis environment for genetic marker analysis.
Bioinformatics, 21(9):2128-2129.
[24] Mardis, E.R., 2008. The impact of next-generation sequencing technology on genetics.
Trends Genet, 24(3):133-141.
[25] Nei, M., 1973. Analysis of gene diversity in subdivided populations.
PNAS, 70(12):3321-3323.
[26] Nishitani, C., Terakami, S., Sawamura, Y., 2009. Development of novel EST-SSR markers derived from Japanese pear (
Pyrus pyrifolia).
Breed Sci, 59(4):391-400.
[27] Pavlicek, A., Hrda, S., Flegr, J., 1999. Free-tree—freeware program for construction of phylogenetic trees on the basis of distance data and bootstrap/jackknife analysis of the tree robustness. Application in the RAPD analysis of genus
Frenkelia
.
Folia Biol (Praha), 45(3):97-99.
[28] Potter, D., Eriksson, T., Evans, R.C., 2007. Phylogeny and classification of Rosaceae.
Plant Syst Evol, 266(1-2):5-43.
[29] Powell, W., Machray, G.C., Provan, J., 1996. Polymorphism revealed by simple sequence repeats.
Trends Plant Sci, 1(7):215-222.
[30] Reilly, J.F., Martinez, S.D., Mickey, G., 2002. A novel role for farnesyl pyrophosphate synthase in fibroblast growth factor-mediated signal transduction.
Biochem J, 366(2):501-510.
[31] Rubtsov, G.A., 1944. Geographical distribution of the genus
Pyrus and trends and factors in its evolution.
Am Nat, 78(777):358-366.
[32] Schuelke, M., 2000. An economic method for the fluorescent labeling of PCR fragments.
Nat Biotechnol, 18(2):233-234.
[33] Singh, H., Deshmukh, R.K., Singh, A., 2010. Highly variable SSR markers suitable for rice genotyping using agarose gels.
Mol Breed, 25(2):359-364.
[34] Teng, Y., Tanabe, K., 2004. Reconsideration on the origin of cultivated pears native to East Asia.
Acta Hortic, 634:175-182.
[35] Teng, Y., Tanabe, K., Tamura, F., 2002. Genetic relationships of
Pyrus species and cultivars native to East Asia revealed by randomly amplified polymorphic DNA markers.
J Am Soc Hortic Sci, 127(2):262-270.
[36] Thiel, T., Michalek, W., Varshney, R., 2003. Exploiting EST databases for the development and characterization of gene-derived SSR-markers in barley (
Hordeum vulgare L.).
Theor Appl Genet, 106(3):411-422.
[37] Tth, G., Gspri, Z., Jurka, J., 2000. Microsatellites in different eukaryotic genomes: survey and analysis.
Genome Res, 10(7):967-981.
[38] van Oosterhout, C., Hutchinson, W.F., Wills, D.P., 2004. MICRO-CHECKER: software for identifying and correcting genotyping errors in microsatellite data.
Mol Ecol Notes, 4(3):535-538.
[39] Varshney, R.K., Graner, A., Sorrells, M.E., 2005. Genic microsatellite markers in plants: features and applications.
Trends Biotechnol, 23(1):48-55.
[40] Varshney, R.K., Grosse, I., Hhnel, U., 2006. Genetic mapping and BAC assignment of EST-derived SSR markers shows non-uniform distribution of genes in the barley genome.
Theor Appl Genet, 113(2):239-250.
[41] Vendramin, E., Dettori, M.T., Giovinazzi, J., 2006. A set of EST-SSRs isolated from peach fruit transcriptome and their transportability across
Prunus species.
Mol Ecol Notes, 7(2):307-310.
[42] Wang, Y.W., Samuels, T.D., Wu, Y.Q., 2011. Development of 1030 genomic SSR markers in switchgrass.
Theor Appl Genet, 122(4):677-686.
[43] Wang, Z., Gerstein, M., Snyder, M., 2009. RNA-Seq: a revolutionary tool for transcriptomics.
Nat Rev Genet, 10(1):57-63.
[44] Wu, J., Wang, Z., Shi, Z., 2013. The genome of the pear (
Pyrus bretschneideri Rehd.).
Genome Res, 23(2):396-408.
[45] Wnsch, A., Hormaza, J.I., 2007. Characterization of variability and genetic similarity of European pear using microsatellite loci developed in apple.
Sci Hortic, 113(1):37-43.
[46] Yamamoto, T., Kimura, T., Sawamura, Y., 2001. SSRs isolated from apple can identify polymorphism and genetic diversity in pear.
Theor Appl Genet, 102(6-7):865-870.
[47] Yamamoto, T., Kimura, T., Shoda, M., 2002. Genetic linkage maps constructed by using an interspecific cross between Japanese and European pears.
Theor Appl Genet, 106(1):9-18.
[48] Yamamoto, T., Kimura, T., Soejima, J., 2004. Identification of quince varieties using SSR markers developed from pear and apple.
Breed Sci, 54(3):239-244.
[49] Yao, L., Zheng, X., Cai, D., 2010. Exploitation of
Malus EST-SSRs and the utility in evaluation of genetic diversity in
Malus and
Pyrus
.
Genet Resour Crop Ev, 57(6):841-851.
[50] Yeh, F., Boyle, T.J.B., 1997. Population genetic analysis of codominant and dominant markers and quantitative traits.
Belg J Bot, 129:157
[51] You, F.M., Huo, N., Gu, Y.Q., 2008. BatchPrimer3: a high throughput web application for PCR and sequencing primer design.
BMC Bioinformatics, 9(1):253
[52] Zhang, G., Xu, S., Mao, W., 2013. Determination of the genetic diversity of vegetable soybean [
Glycine max (L.) Merr.] using EST-SSR markers.
J Zhejiang Univ-Sci B (Biomed & Biotechnol), 14(4):279-288.
[53] Zheng, X., Hu, C., Spooner, D., 2011. Molecular evolution of
Adh and
LEAFY and the phylogenetic utility of their introns in
Pyrus (Rosaceae).
BMC Evol Biol, 11(1):255

Open peer comments: Debate/Discuss/Question/Opinion
<1>