1. Introduction
One of the major challenges in ecology is to understand which factors control the abundance and diversity of species, how these are influenced by natural or human-induced changes, and what are the consequences for ecosystem processes and properties (van der Putten et al.,
2007). Experimental communities help answering some of these questions (Jessup et al.,
2005) and are useful to explain the interactive processes between the microbiota of a complex ecosystem and the different environmental conditions (Moore et al.,
1996). An area of growing interest is biocontrol, which can be studied in the context of biological invasions, since biocontrol isolates must be able to colonize and grow in a recipient community. In this context,
Trichoderma species can be considered as invasive and their success as biocontrol agents will depend on abiotic factors such as availability of resources, or on biotic factors such as the properties of the recipient community as well as the ability of the invasive species to invade it (Savazzini et al.,
2009; Zhang et al.,
2013). Species of the genus
Trichoderma (Family Hypocreaceae; Phylum Ascomycota) are ubiquitous in soil, where they may represent the majority of the fungal biomass (Druzhinina et al.,
2011), and play important environmental roles, such as degradation of complex organic compounds and establishment of mutualistic interactions with plants (Kubicek et al.,
2008). Likewise,
Trichoderma spp. have been reported to act as biological control agents by their antagonistic properties towards fungal pathogens (Viterbo et al.,
2001; Benítez et al.,
2004; Harman,
2006; Komon-Zelazowska et al.,
2007), being suggested that they are even able to attack, parasitize, and gain nutrition from other fungi, such as phytopathogens (Druzhinina et al.,
2011).
There are a variety of mechanisms by which
Trichoderma species establish interactions with other organisms; these can be direct, as the aforementioned mycoparasitism, in which
Trichoderma species parasitize other fungi like those belonging to the genera
Pythium,
Phytophthora,
Botrytis,
Rhizoctonia, and
Fusarium, some of which are well known disease agents of plants (Benítez et al.,
2004; Harman,
2006). Another direct mechanism corresponds to amensalism, which is related to the production of antibiotics and peptaibols that directly affect other fungi, being able to act on a synergistic manner with mycoparasitism (Grondona et al.,
1997; Benítez et al.,
2004; Komon-Zelazowska et al.,
2007). However, interactions can also be indirect, such as competition for nutrients and space, change of environmental conditions, and stimulation of the growth and/or the immune system of plants by endophytism, among others (Harman et al.,
2004; Harman,
2006). Due to the relevance of
Trichoderma species in terrestrial ecosystems and their ability to successfully colonize different habitats (Schuster and Schmoll,
2010; Kredics et al.,
2014), a proper identification of
Trichoderma strains is crucial for understanding how this fungus colonizes a recipient microbial community. Various procedures have been proposed and designed for monitoring
Trichoderma strains, both in experimental and environmental communities, which range from their cultivation in selective media (Knudsen et al.,
1996; Williams et al.,
2003; Vargas-Gil et al.,
2009) to the genetic modification of such organisms (Green and Jensen,
1995). Another way of performing this monitoring is through the identification of the strain(s) or species by specific molecular markers (Hermosa et al.,
2000; Druzhinina and Kubicek,
2005; Kubicek et al.,
2008). In many cases, sequence-characterized amplified region (SCAR) markers have been developed by converting dominant randomly amplified polymorphic DNA (RAPD) fingerprints into specific molecular markers (Parasnis et al.,
2000; Koveza et al.,
2001; Arnedo-Andrés et al.,
2002; Bautista et al.,
2003; Rubio et al.,
2005; Feng et al.,
2011). The main aim of the present study was to develop a SCAR molecular marker to specifically detect some
Trichoderma cf.
harzianum strains for monitoring the colonization and growth of
T. cf.
harzianum when it invades experimental communities. This work is a part of a research project on biological invasions in which experimental fungal communities are used as study models to assess the biotic and abiotic factors determining the success of
T. cf.
harzianum as an invasive species.
2. Materials and methods
2.1. Fungal samples and culture conditions
Fourteen strains of filamentous fungi belonging to the genus
Trichoderma were provided by Castillo (
2009), labeled as BpT1a, BpT2, BpT5, BpT6, BpT7, BpT9, BpT10, BpT10a, BpTA, BpTC, BpTF, BpTH, BpTP, and BpTR (Table
1). From each sample, monosporic cultures were prepared from serial dilutions of an aqueous conidial suspension (NaCl 0.7 g/ml) derived from 7-d-old cultures, which were spread on potato dextrose agar (PDA; Difco™) medium. The plates were incubated at 25 °C until single colonies were observed (2–3 d), which were then re-inoculated on PDA medium to ensure the purity of the culture (Gams and Bissett,
1998). In addition, 20 DNA samples were provided by Biopacific Co., Ltd. (Chile), 8 of which corresponded to
T. cf.
harzianum (1, 2, 3, 4, 6, 7, 8, and 9), 6 to
Penicillium spp. (Atc4, Atc5, 9a, 9ar1, C1R, and C3F), 3 to
Aspergillus spp. (HI, HC1, and 4a), and the other 3 to
Davidiella sp. (HM),
Paecilomyces sp. (9ar), and
Monascus sp. (Atc8) (Table
1). In addition, the fungal species
Aspergillus niger (MR-1),
Purpureocillium sp. (MR-6),
Paecilomyces variotti (MR-9),
Beauveria bassiana (MR-21),
Talaromyces flavus (MR-25), and
Cladosporium cladosporoides (MR-12) were obtained from the fungal collection of the laboratory of Microbial Ecology, Faculty of Sciences, University of Chile (Table
1).
Table 1
Fungal strains and DNA samples used in this study
| Strain |
Species |
Origin |
ITS accession No. |
Most related sequence accession No.*
|
Identity (%) |
| BpT1a |
Trichoderma novaezelandiae
|
Neltume, Chile |
KC812353 |
AY154925 |
99 (100) |
| BpT2 |
Trichoderma sp. |
Neltume, Chile |
KC812352 |
KC007277 |
99 (100) |
| BpT5 |
Trichoderma atroviride
|
Neltume, Chile |
KC812350 |
KC171717 |
99 (96) |
| BpT6 |
Trichoderma cf. harzianum
|
Laja River, Chile |
KC812342 |
JX088246 |
100 (100) |
| BpT7 |
Trichoderma cf. harzianum
|
Laja River, Chile |
KC812343 |
JX088246 |
100 (100) |
| BpT9 |
Trichoderma atroviride
|
Laja River, Chile |
KC812349 |
KC171717 |
99 (96) |
| BpT10 |
Trichoderma atroviride
|
Port Fuy, Chile |
KC812348 |
KC171717 |
99 (96) |
| BpT10a |
Trichoderma cf. harzianum
|
Port Fuy, Chile |
KC812341 |
JN716380 |
100 (100) |
| BpTA |
Trichoderma cf. harzianum
|
Neltume, Chile |
KC812340 |
JX416574 |
99 (89) |
| BpTC |
T. atroviride
|
Port Fuy, Chile |
KC812346 |
KC171717 |
99 (96) |
| BpTF |
Trichoderma cf. harzianum
|
Laja River, Chile |
KC812345 |
JX088246 |
100 (100) |
| BpTH |
Trichoderma cf. harzianum
|
Port Fuy, Chile |
KC812344 |
JX088246 |
100 (100) |
| BpTP |
Trichoderma citrinoviride
|
Port Consuelo, Chile |
KC812351 |
JX173874 |
100 (100) |
| BpTR |
Trichoderma atroviride
|
Laja River, Chile |
KC812347 |
KC171717 |
99 (96) |
| 1 |
Trichoderma cf. harzianum
|
Biopacific Co., Ltd., Chile |
KC812364 |
JX416561 |
100 (89) |
| 2 |
Trichoderma cf. harzianum
|
Biopacific Co., Ltd., Chile |
KC812365 |
JX088246 |
100 (100) |
| 3 |
Trichoderma cf. harzianum
|
Biopacific Co., Ltd., Chile |
KC812366 |
JX416561 |
100 (89) |
| 4 |
Trichoderma cf. harzianum
|
Biopacific Co., Ltd., Chile |
KC812367 |
JN716380 |
100 (100) |
| 6 |
Trichoderma cf. harzianum
|
Biopacific Co., Ltd., Chile |
KC812368 |
AY605728 |
99 (94) |
| 7 |
Trichoderma cf. harzianum
|
Biopacific Co., Ltd., Chile |
KC812369 |
JX416561 |
100 (89) |
| 8 |
Trichoderma cf. harzianum
|
Biopacific Co., Ltd., Chile |
KC812370 |
JX644593 |
99 (98) |
| 9 |
Trichoderma cf. harzianum
|
Biopacific Co., Ltd., Chile |
KC812371 |
JX416574 |
99 (89) |
| Atc4 |
Penicillium sp. |
Biopacific Co., Ltd., Chile |
KC812357 |
JX869567 |
100 (100) |
| Atc5 |
Penicillium sp. |
Biopacific Co., Ltd., Chile |
KC812358 |
JX406503 |
100 (100) |
| 9a |
Penicillium sp. |
Biopacific Co., Ltd., Chile |
KC812359 |
FJ025212 |
100 (100) |
| 9ar1 |
Penicillium sp. |
Biopacific Co., Ltd., Chile |
KC812360 |
JN585940 |
100 (100) |
| C1R |
Penicillium sp. |
Biopacific Co., Ltd., Chile |
NA |
NA |
NA |
| C3F |
Penicillium sp. |
Biopacific Co., Ltd., Chile |
NA |
NA |
NA |
| HC1 |
Aspergillus sp. |
Biopacific Co., Ltd., Chile |
KC812355 |
JQ316527 |
99 (100) |
| HI |
Aspergillus sp. |
Biopacific Co., Ltd., Chile |
KC812356 |
HM061131 |
100 (100) |
| 4a |
Aspergillus sp. |
Biopacific Co., Ltd., Chile |
KC812354 |
FR670319 |
100 (100) |
| HM |
Davidiella sp. |
Biopacific Co., Ltd., Chile |
KC812361 |
JF911765 |
100 (100) |
| 9ar |
Paecilomyces sp. |
Biopacific Co., Ltd., Chile |
KC812362 |
GU980015 |
100 (100) |
| Atc8 |
Monascus sp. |
Biopacific Co., Ltd., Chile |
KC812363 |
JN942665 |
100 (100) |
| MR-1**
|
Aspergillus niger
|
El Romeral, Chile |
NA |
NA |
NA |
| MR-9**
|
Paecilomyces variotti
|
El Romeral, Chile |
NA |
NA |
NA |
| MR-21**
|
Beauveria bassiana
|
El Romeral, Chile |
NA |
NA |
NA |
| MR-6**
|
Purpureocillium sp. |
El Romeral, Chile |
NA |
NA |
NA |
| MR-25**
|
Talaromyces flavus
|
El Romeral, Chile |
NA |
NA |
NA |
| MR-12**
|
Cladosporium cladosporoides
|
El Romeral, Chile |
NA |
NA |
NA |
*Most related sequence retrieved by BLAST using as query the ITS1-5.8S rDNA-ITS2 region of the samples
**Strains from the Fungal Collection of the Microbial Ecology Laboratory, Faculty of Sciences, University of Chile
NA: not available
2.2. DNA extraction, polymerase chain reaction (PCR) amplification, and sequencing
Genomic DNA (gDNA) was extracted from fresh monosporic mycelia using the PowerSoil™ DNA extraction kit (MoBio Laboratories Inc.) according to the manufacturer’s instructions. The quality and integrity of the extracted DNA were visualized in 0.8% (8 g/L) agarose gels in 1× TAE buffer (40 mmol/L Tris-acetate, 1 mmol/L EDTA (pH 8.0)) stained with GelRed™ (Biotium). All DNA samples were stored at −20 °C until analysis. A fragment corresponding to the 5.8S ribosomal RNA (rRNA) gene and the two ribosomal internal transcribed spacers (ITS1 and ITS2) of the ribosomal region were amplified by PCR using primers ITS1 (5'-TCCGTAGGTGAACCTGCGG-3') and ITS4 (5'-TCCTCCGCTTATTGATATGC-3') (White et al.,
1990).
The amplifications were carried out in a total volume of 25 μl containing 1 μl of gDNA (20±5) ng, with primers at a concentration of 400 nmol/L each, and the reagents provided in the GoTaq® Green Master Mix (Promega, USA; GoTaq® DNA polymerase in 1× Green GoTaq® reaction buffer (pH 8.5), 200 μmol/L of each dNTP, and 1.5 mmol/L MgCl
2). The thermal cycles consisted of 3 min of initial denaturation at 94 °C, 37 cycles of denaturation at 94 °C for 30 s, then 30 s annealing at 55 °C and 3 min extension at 72 °C, and a final extension of 20 min at 72 °C on a MaxyGene thermocycler (Axygen). PCR products were evaluated on 1.2% (12 g/L) agarose gels, with the conditions above mentioned using the 100 bp (Invitrogen) as the molecular weight marker. Amplicons were sequenced (Macrogen Inc., Seoul, Korea) using a Genetic Analyzer 3730XL (Applied Biosystems). The identity of each sequence was assessed using the Basic Local Alignment Search Tool (BLAST) (Altschul et al.,
1990). In addition, all sequences belonging to the genus
Trichoderma were identified by
TrichOKEY 2.0 (Druzhinina et al.,
2005).
2.3. RAPD
To carry out RAPD analyses, 16 arbitrary 10-mer primers (Operon, USA) were tested against purified gDNA from different
Trichoderma species, including some
T. cf.
harzianum strains, and non-
Trichoderma DNA samples from the genera
Aspergillus,
Penicillium, and
Monascus (HI, Atc4, and Atc8 strains, respectively). The PCR reactions were performed as mentioned above. The thermal cycling was as described by Lehmann et al. (
1992), consisting of an initial denaturation of 5 min at 94 °C, followed by 45 cycles of 1 min at 94 °C, 1 min at 36 °C, 2 min at 72 °C, and a final extension of 10 min at 72 °C, using a MaxyGene thermocycler (Axygen). PCR products were analyzed by electrophoresis in 1.5% (15 g/L) agarose gels using the above mentioned conditions.
2.4. Cloning and sequencing of an RAPD amplicon
The band of interest identified in the RAPD analysis (Fig.
1) was gel-excised and purified using the Wizard SV Gel and PCR Clean-Up system kit (Promega), ligated to the pTZ-57R/T vector (Fermentas) and then transformed into
Escherichia coli using the InsTA clone PCR cloning kit (Fermentas). The transformants were grown in Luria-Bertani (LB) medium and selected by their resistance to ampicillin (50 μg/ml) and their inability to hydrolyze X-Gal (5-bromo-4-chloro-3-indolyl-β-
D-galactopyranoside) in the presence of isopropylthio-β-galactoside (IPTG). The presence of the expected size insert was confirmed by colony-PCR using primers M13F (5'-GTAAAACGACGGCCAG-3') and M13R (5'-CAGGAAACAGCTATGACC-3').
Fig.1RAPD fingerprintings of fungal species
Agarose gel showing the RAPD banding profile amplified from fungal gDNA using the OPX02 primer. Lanes labeled as BpTF, BpTH, BpT7, BpT6, BpT10a, and BpTA correspond to isolates of
T. cf.
harzianum; BpTC, BpTR, BpT5, and BpT10, BpT9 of
T. atroviride; BpT1a of
T. novaezelandiae; BpT2 of
Trichoderma sp.; BpTP of
T. citrinoviride; HI of
Aspergillus sp.; Atc4 of
Penicillium sp.; and, Atc8 of
Monascus sp. (Table
1). The 100-bp ladder was used as a molecular weight marker
The amplified product was sequenced (Macrogen Inc., Seoul, Korea) in both directions using a Genetic Analyzer 3730XL (Applied Biosystems). The sequencing result was edited and subsequently evaluated using BLAST-n (Altschul et al.,
1990) to determine whether this sequence had some identity with any of the known sequences present in the GenBank database of the National Center for Biotechnology Information (NCBI) (Benson et al.,
2013). Finally, a local BLAST of this sequence with the genome of
T. harzianum CBS 226.95 available at the Doe Joint Genome Institute web page (
http://genome.jgi.doe.gov/) was performed to determine the number of copies of the SCAR marker.
2.5. Design of SCAR primers
The SCAR primers were designed using the NCBI primer-BLAST tool, which uses the Primer3 tool (Rozen and Skaletsky,
1999). Five primers were designed: two forward primers (2F1 and 2F2) and three reverse primers (2R1, 2R2, and 2R3) (Table
2). To evaluate these primers and to define the PCR annealing temperature, DNA from
T. cf.
harzianum BpTF was used as the template. The conditions of the reagents were the same as in the above mentioned amplification protocols, except that the concentration of each primer was 200 nmol/L. The thermal cycling was as follows: initial denaturation of 3 min at 94 °C, followed by 30 cycles of 1 min denaturation at 94 °C, 1 min annealing, where the temperature ranged between 40 and 64 °C, 1 min extension at 72 °C, and a final extension of 7 min at 72 °C. Once the thermal cycling conditions were assessed, the primers were evaluated using 22 DNA samples from
Trichoderma belonging to five different species in addition to DNA from species of the genera
Penicillium,
Aspergillus,
Davidiella,
Paecilomyces, and
Monascus.
Table 2
Characteristics of the designed SCAR primers
| SCAR primer |
Sequence (5'→3') |
Position in the RAPD fragment (bp) |
GC (%) |
T
m (°C) |
| 2F1 |
TCCGCCACCATCTAGACCAATCG |
2–23 |
56.5 |
58.28 |
| 2F2 |
TGGCTCGTCGTAGTTCGGAGAAG |
51–73 |
56.5 |
58.26 |
| 2R1 |
CCACCGCGGGATTCATGCACT |
474–494 |
65.0 |
58.68 |
| 2R2 |
CCAGATCGGCCACCGAAGAAAC |
307–328 |
59.1 |
57.92 |
| 2R3 |
GCCACCCACCGCGGGATTCA |
480–499 |
70.0 |
61.78 |
GC: guanine-cytosine; T
m: melting temperature
2.6. Real-time quantitative PCR (qPCR) assays
Primers 2F2 and 2R2 were additionally tested in real-time qPCR assays. Reactions were carried out in an Mx3000P real-time PCR system (Stratagene) using the GoTaq® Real-Time qPCR Master Mix (Promega). All reactions were performed in a total volume of 20 μl, with 0.3 μmol/L of each primer and 1 μl of template DNA at the concentrations required by each assay. The thermal cycling was as follows: 2 min of denaturation at 95 °C, 40 cycles consisting of 15 s denaturation at 95 °C, then 1 min annealing at 64 °C and 1 min extension at 72 °C.
To quantify the number of SCAR copies specifically detected by the primers evaluated by real-time qPCR, three standard curves in quadruplicate were performed using 10-fold serial dilutions of different DNA templates (1–10
−5 ng): (1) gDNA of
T. cf.
harzianum BpT10a, (2) a linearized plasmid (pTZ57R/T) containing the SCAR marker, and (3) an equimolar mix of fungal gDNA from several species (
P. canescens [MR-13],
A. niger [MR-1],
C. cladosporoides [MR-12],
P. variotii [MR-9], and
T. flavus [MR-25]). The SCAR copy numbers were determined using the proportion between the nucleotide mass and the nucleotide number according to the ratio 1.096×10
−21 g/bp; besides, the sizes of the
T. harzianum CBS 226.95 genome (40.98 Mbp) and the plasmid with the SCAR sequence (3164 bp) were also considered. The threshold cycle (
C
t) of each 10-fold serial dilution reaction was plotted versus the number of SCAR copies expressed as log. Using a linear regression analysis, the slope and the determination coefficients (
r
2) of the three assays were calculated. In addition, the percentage of efficiency was obtained for each of the three standard curves according to: efficiency=(10
−1/slope−1)×100%.
The sensibility of the SCAR primers to detect
T. cf.
harzianum by qPCR was assessed by using 10-fold serial dilutions of the aforementioned DNA templates. In the latter case, in addition to the equimolar gDNA mix from the five fungal species, six additional mixes were made, where
T. cf.
harzianum gDNA was present in decreasing percentages (10%, 5%, 2%, 1%, 0.2%, and 0.1%). The six assays were replicated four times under the same reaction conditions as above mentioned.
Finally, the SCAR primers were evaluated in two experimental fungal communities inoculated with
T. cf.
harzianum, where its colonization and growth were monitored by qPCR. The experimental communities were set up in 20 ml flasks using 1 g of rock wool as a support matrix soaked with Vogel medium (supplemented with yeast extract 0.5%, dextrose 0.5%, and chloramphenicol 30 μg/ml) to reach 60% of the water-holding capacity (WHC). Experimental communities were assembled in duplicates and consisted of the following: Community 1 was composed of
T. citrinoviride (BpTP),
T. novaezelandiae (BpT1a),
T. atroviride (Bpt10),
B. bassiana (MR-21), and
Purpureocillium sp. (MR-6); and Community 2 was composed of
P. canescens (MR-13),
A. niger (MR-1),
C. cladosporoides (MR-12),
P. variotii (MR-9), and
T. flavus (MR-25).
Each community was inoculated with 2×10
4 spores of each fungal isolate and incubated at 25 °C; after 3 d they were inoculated with 2×10
4 spores of
T. cf.
harzianum BpT10a. Fungal experimental communities without
T. cf.
harzianum BpT10a were built in duplicate as controls. Destructive samplings were carried out 0, 3, 7, and 10 d after inoculation with
T. cf.
harzianum BpT10a and the gDNA was extracted with the PowerSoil™ DNA extraction kit (MoBio Laboratories Inc.). gDNA was quantified using the Take3™ Epoch MicroVolume Plate reader (Biotek) and 1 ng was used as the template for the qPCR reactions, which were performed under the same conditions above mentioned. The fungal gDNA-mix standard curve was used to calculate the copy number of the SCAR marker in each community.
3. Results
3.1. Molecular identification of fungal strains
All fungal strains and DNA samples were identified by amplification and sequencing of the molecular marker ITS1-5.8S rDNA-ITS2 and the subsequent search, by means of BLAST-n, in databases from NBCI and the barcode tool for
Trichoderma (
TrichOKEY2.0) (Druzhinina et al.,
2005) when possible. The sequences of the isolates were related with nine different genera (
Trichoderma,
Penicillium,
Aspergillus,
Davidiella,
Paecilomyces,
Monascus,
Beauveria,
Talaromyces, and
Cladosporium) confirming all the previous identifications (Table
1).
3.2. SCAR marker design
The SCAR marker for
T. cf.
harzianum was designed through an RAPD assay. The amplicons obtained ranged between 200 and 2350 bp, resulting in highly polymorphic patterns for some of the used primers. However, for the design of the SCAR marker, only those amplicons with high intensity and reproducibility were considered. Using the primer OPX-02, a band of approximately 500 bp was detected, which was common to all the
T. cf.
harzianum strains (Figs.
1 and
S1). This band of interest was gel-excised and purified from the T. cf. harzianum BpTF isolate; then it was cloned into the pTZ57R/T vector and transformed into E. coli. Five transformants were selected and the insert was recovered using the M13 primers, obtaining a fragment of about 650 bp. The amplicons were sequenced in both directions using the primers M13F and M13R. The sequences were edited (vector sequences were removed) leaving only the fragment of interest, which resulted in a sequence of 503 nucleotides (Fig. S2). A BLAST-n analysis of this sequence showed no identity with any other sequences in GenBank. Furthermore, the local BLAST analysis performed against the T. harzianum CBS 226.95 genome showed that it was present in a single copy (Table S1). Based on the DNA sequence of the cloned 503-bp fragments (FASTA S1), SCAR primers were designed, including the primer sequences initially used for the RAPD analyses. Next, internal primer pairs were designed for reaching better amplification results. The primer positions are shown in Fig. S2.
By means of an in silico evaluation of the primers, their sequences, GC (guanine-cytosine) contents, T
m (melting temperature) values, and positions in the RAPD sequenced fragment were determined (Table 2).
3.3. SCAR marker evaluation
SCAR primers were evaluated using a gradient of annealing temperatures, with the gDNA from T. cf. harzianum BpTF as the template. The SCAR primers were evaluated using different combinations of them. Two primer combinations, 2F2/2R2 and 2F2/2R3, generated an intense band of the expected size in the whole tested temperature range (40–64 °C). To avoid non-specific amplification, the higher annealing temperature was chosen to carry out subsequent assays. The other primer combinations did not yield any amplification products and no non-specific bands were obtained. PCR reactions were conducted using gDNA from all the Trichoderma isolates included in Table 1, along with the gDNA corresponding to species of the genera Penicillium (Atc4, Atc5, 9a, 9ar1, C1R, and C3F), Aspergillus (HI, HC1, and 4a), Davidiella (HM), Paecilomyces (9ar), Monascus (Atc8), and a mixture of species from a compost sample (C3R). Primer pair 2F2/2R2 amplified only the 278-bp expected product from the 14 T. cf. harzianum DNA samples (Fig. 2), and no amplifications were obtained from the other non-Trichoderma species. Similar results were observed with the primer pair 2F2/2R3, which generated the 448-bp expected amplified product in all the reactions where T. cf. harzianum DNA was used as the template (Fig. S3). Therefore, both primers were suitable for amplifying the SCAR marker by conventional PCR; however, in the case of the qPCR primer pair, 2F2/2R2 was preferred because it yielded the shortest fragment.
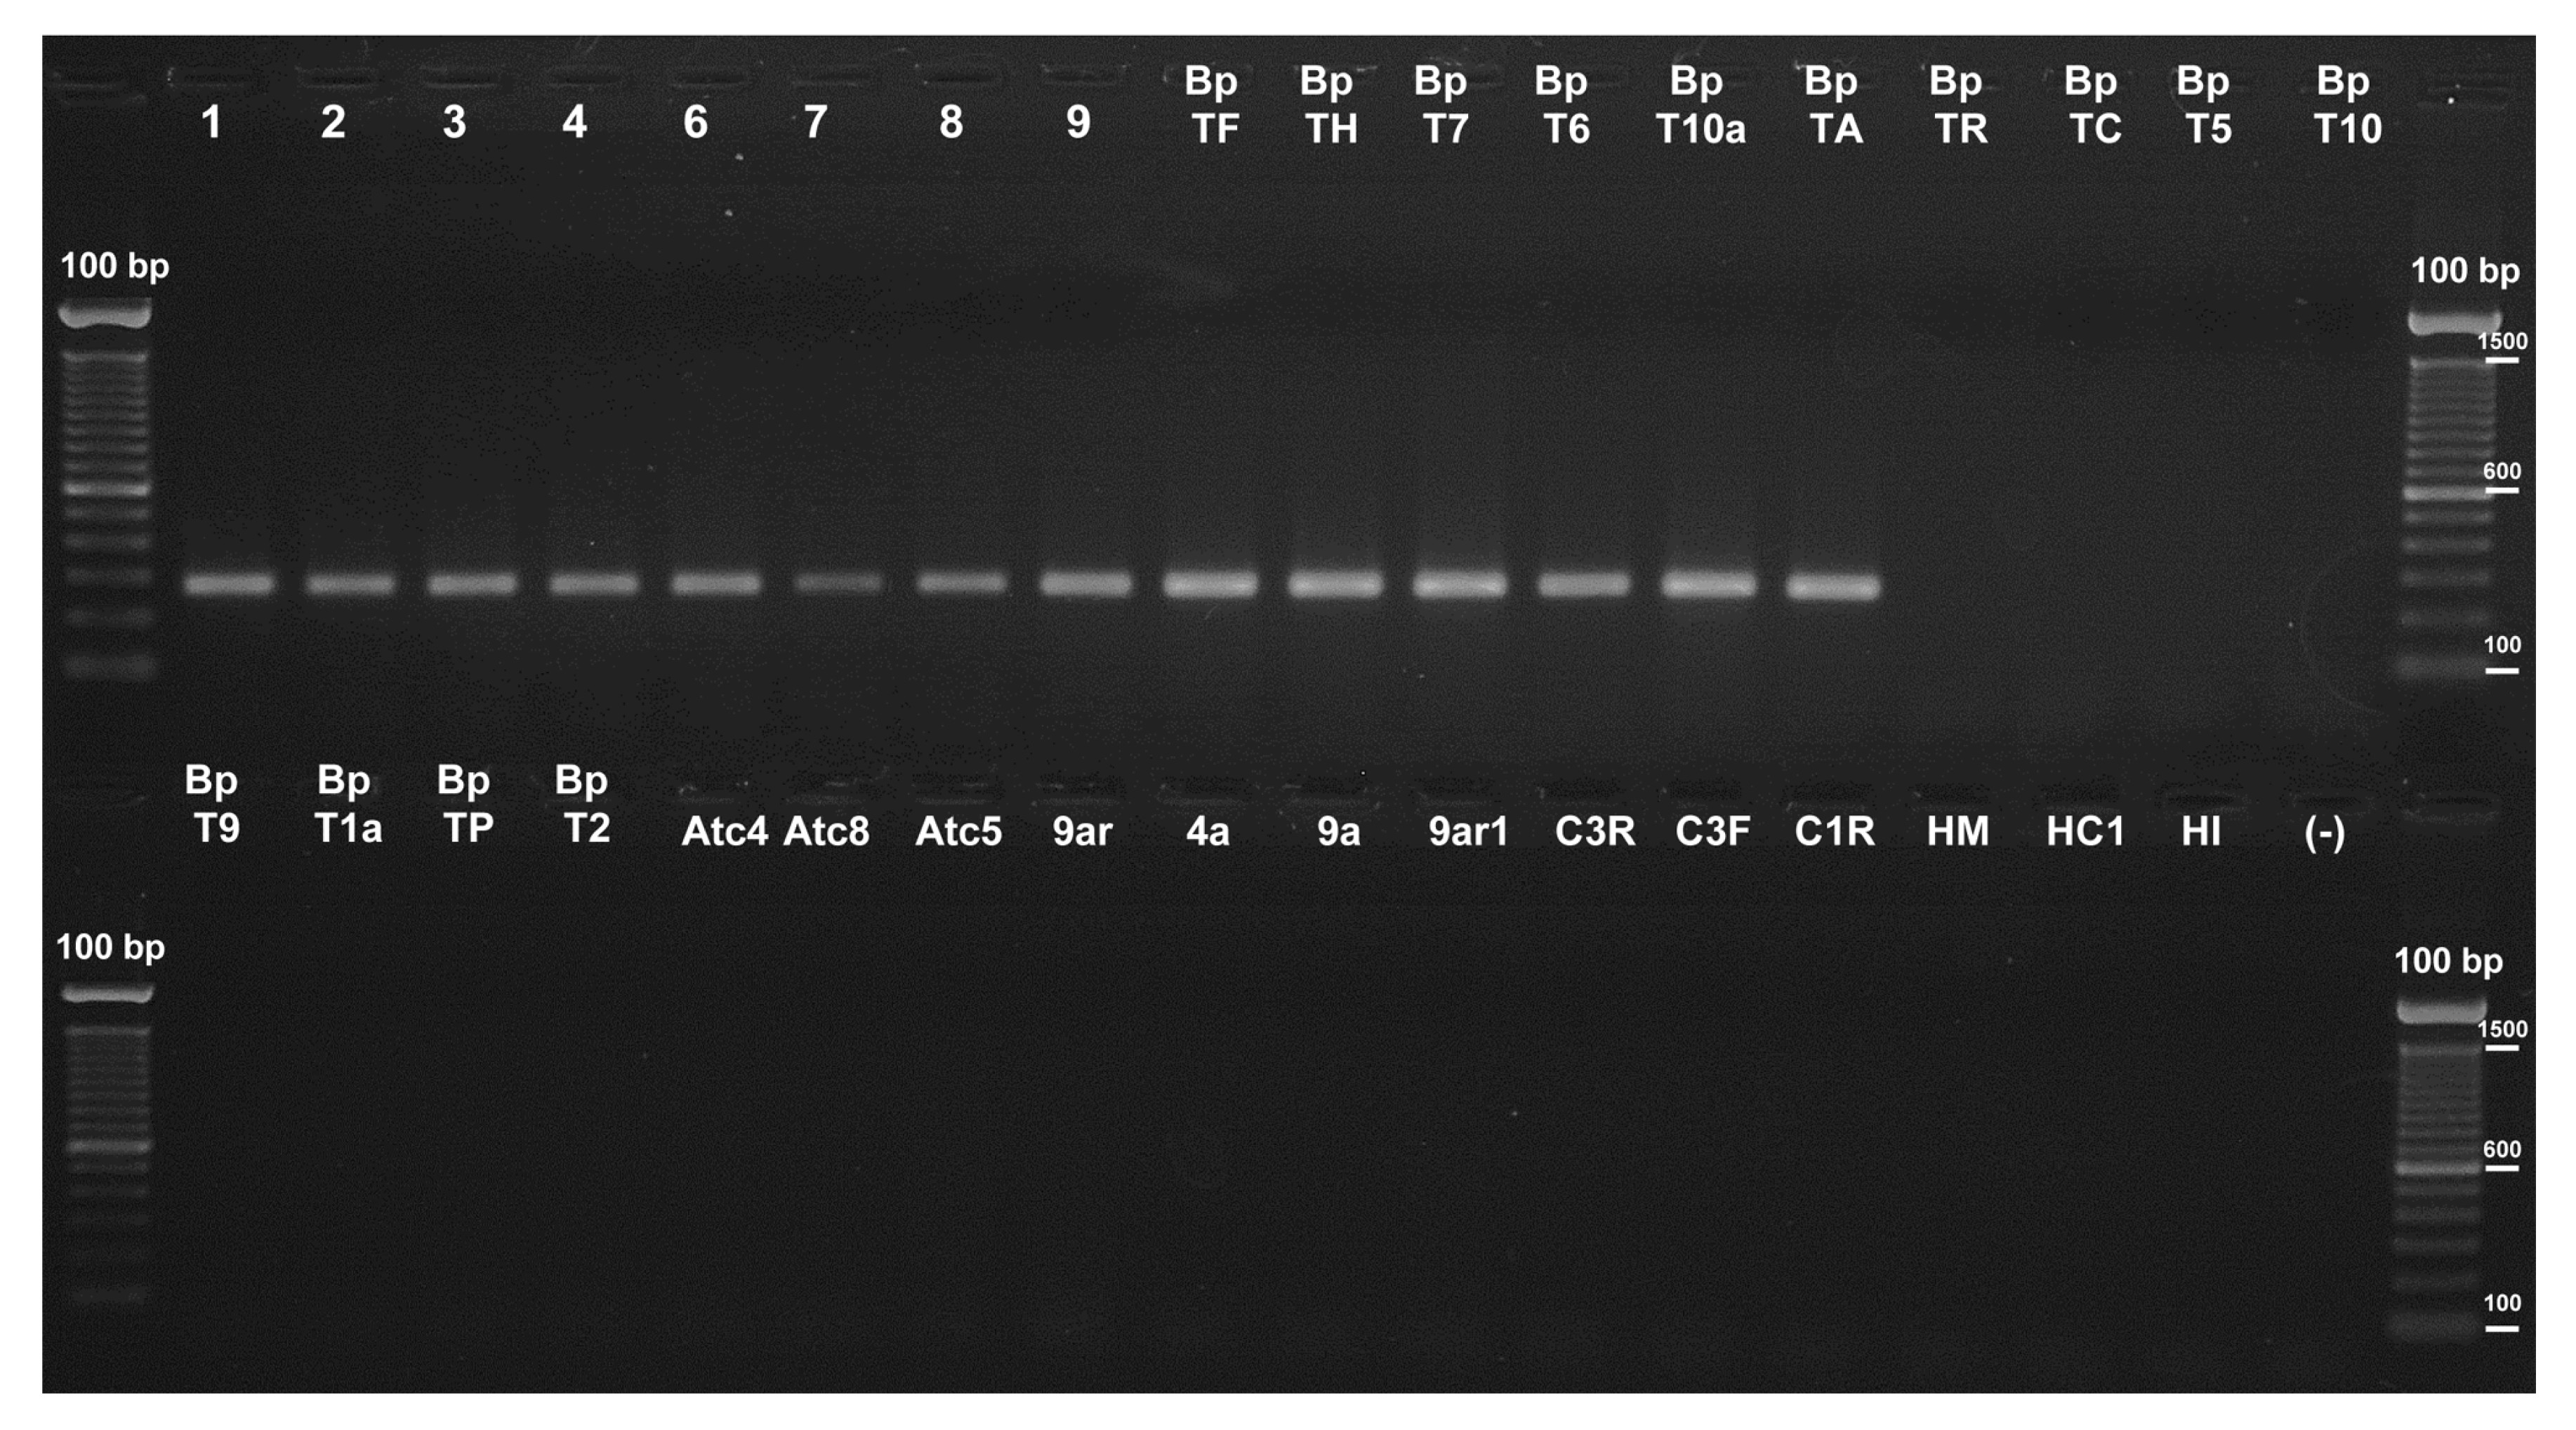
Fig.2Evaluation of the SCAR marker primers by PCR
The 278-bp fragments amplified from different
T. harzianum strains using the SCAR 2F2 and 2R2 primers are shown in the agarose gel together with the absence of amplification from other fungal species. Lanes labeled as 1, 2, 3, 4, 6, 7, 8, 9, BpTF, BpTH, BpT7, BpT6, BpT10a, and BpTA correspond to gDNA from
T. cf.
harzianum isolates; BpTR, BpTC, BpT5, BpT10, and BpT9 from
T. atroviride; BpT1a from
T. novaezelandiae; BpTP from
T. citrinoviride; BpT2 from
Trichoderma sp.; Atc4, Atc5, 9a, 9ar1, C1R, and C3F from
Penicillium spp.; HI, HC1, and 4a from
Aspergillus spp.; HM from
Davidiella sp.; 9ar from
Paecilomyces sp.; Atc8 from
Monascus sp. (see Table
1 for details); and C3R from a compost sample. (−) is a negative control. As a molecular weight marker the 100-bp ladder was used
Using the database available at http://genome.jgi.doe.gov/, the SCAR sequence was aligned with 366 fungal genomes, and no hit was observed with non-Trichoderma fungi. In the Trichoderma group, six genomes were available, and no alignment was detected with T. asperellum, T. atroviride, or T. longibrachiatum. In the case of T. harzianum CBS 226.95, as expected, the alignment reported a unique match of 220 bp, indicating that the SCAR marker is present in one copy in this genome. On the other hand, from the two available T. reesei genomes, only a 28-bp match with the SCAR sequence was detected, but this was not coincident with the areas where the primers were expected to anneal. Similarly, in the case of T. virens genome, a 99-bp match was found, but it did not include the annealing region for the 2F2 primer (Table S1). Additionally, the SCAR marker from the tested T. cf. harzianum strains was sequenced to evaluate its variability (Fig. S4). The full-length of the fragments matched, showing only 10 polymorphic sites, the most variable strain being the one of T. cf. harzianum BpT10a (FASTA S2). Moreover, the SCAR marker variability was compared with that of other markers, such as calmodulin (cal1) and translation elongation factor (tef1) genes, each one exhibiting a similar tree topology (Figs. S4 and S5).
3.4. Real-time qPCR
Primer pair 2F2/2R2 was used for the real-time qPCR assays. Only in the qPCR reactions where T. cf. harzianum DNA was used as template, was a signal (C
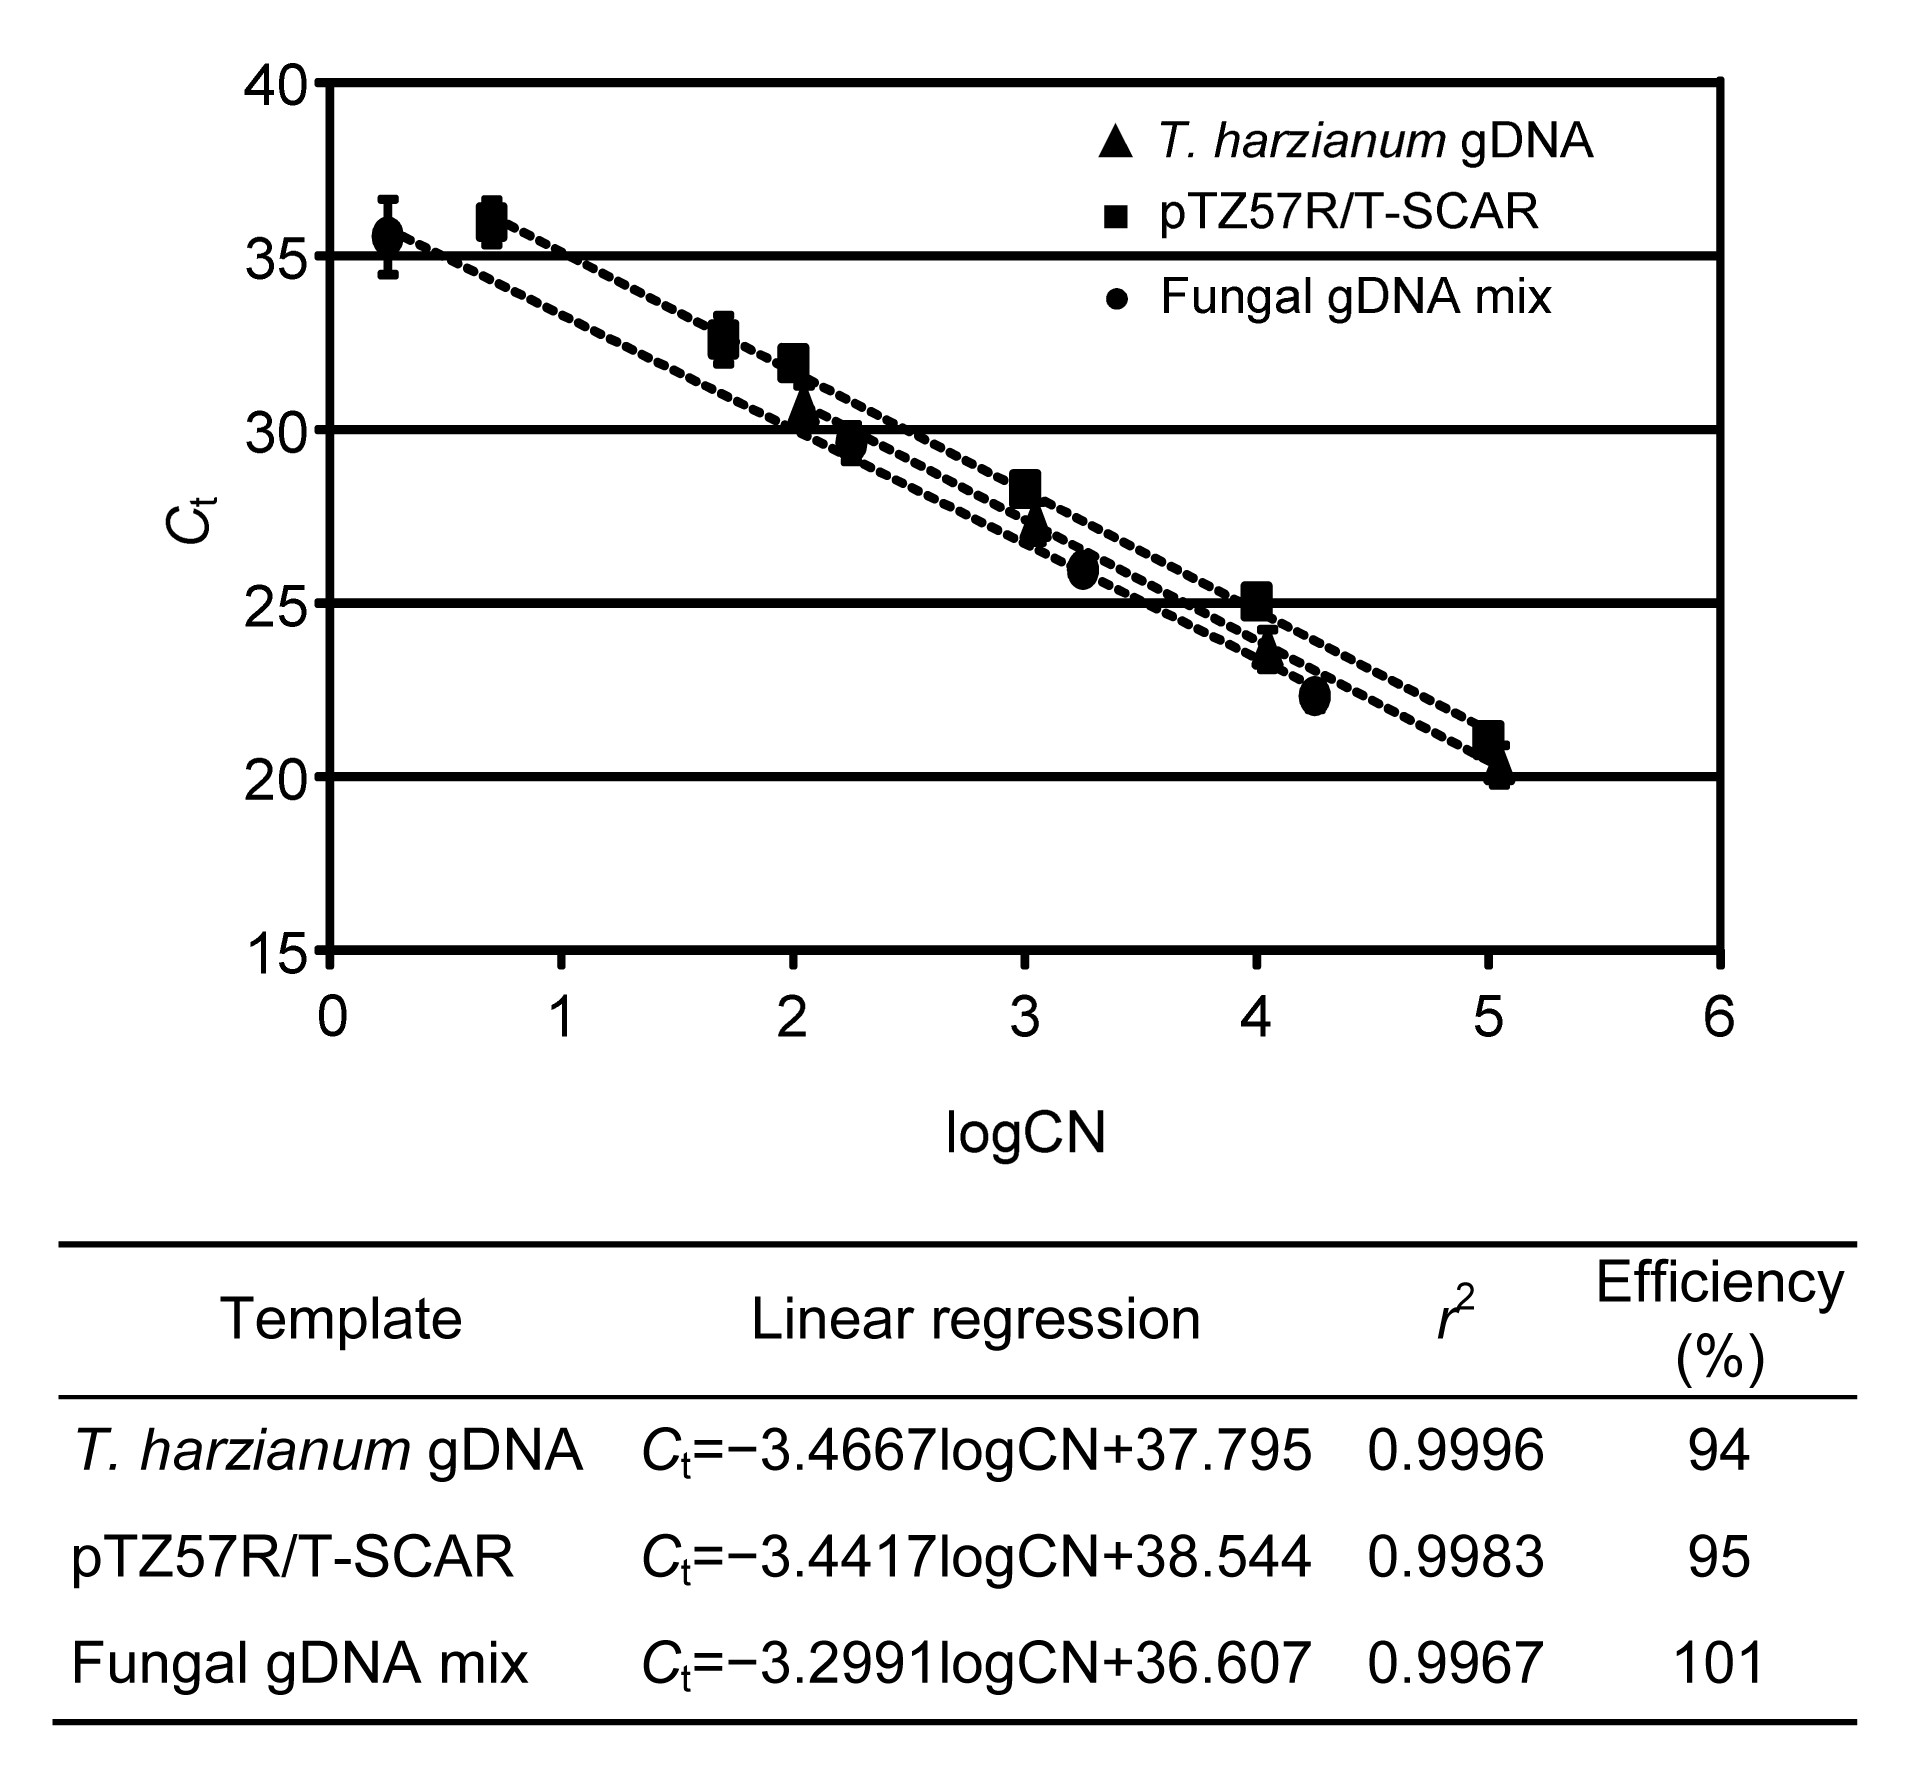
t) detected and a single melting peak observed (data not shown), which indicates that the primers were specific for the SCAR marker of T. cf. harzianum. These results were further checked using electrophoresis in agarose gels, in which only the expected size fragment was observed. In the three standard curves performed using 10-fold serial dilutions of different DNA templates: (1) gDNA of T. cf. harzianum BpT10a, (2) a linearized plasmid containing the SCAR marker, and (3) an equimolar mix of fungal gDNA from several species, qPCR reactions with similar levels of efficiency were reached (Fig. 3). The efficiency of each curve and r
2 values of regression curves are shown in Fig. 3. In all the three standard curves, the linear regressions showed that the target SCAR fragment was detected even when the template included less than 100 copies of the target genome.
Fig.3
Evaluation of SCAR marker primers by real-time quantitative PCR (qPCR)
The SCAR primers were evaluated by qPCR in three different contexts: t. cf. harzianum gDNA, a plasmid with the SCAR fragment, and a mix of fungal gDNA. For the three assays, the linear regression, r
2, and the efficiency of the reaction were calculated. C
t: threshold cycle; CN: copy number
The sensibility of the SCAR marker for monitoring T. cf. harzianum BpT10a in a fungal DNA mix was evaluated, and the results showed that it was possible to detect T. cf. harzianum even at the lowest dilution tested, which represented 0.1% of the total gDNA used for the qPCR reactions.
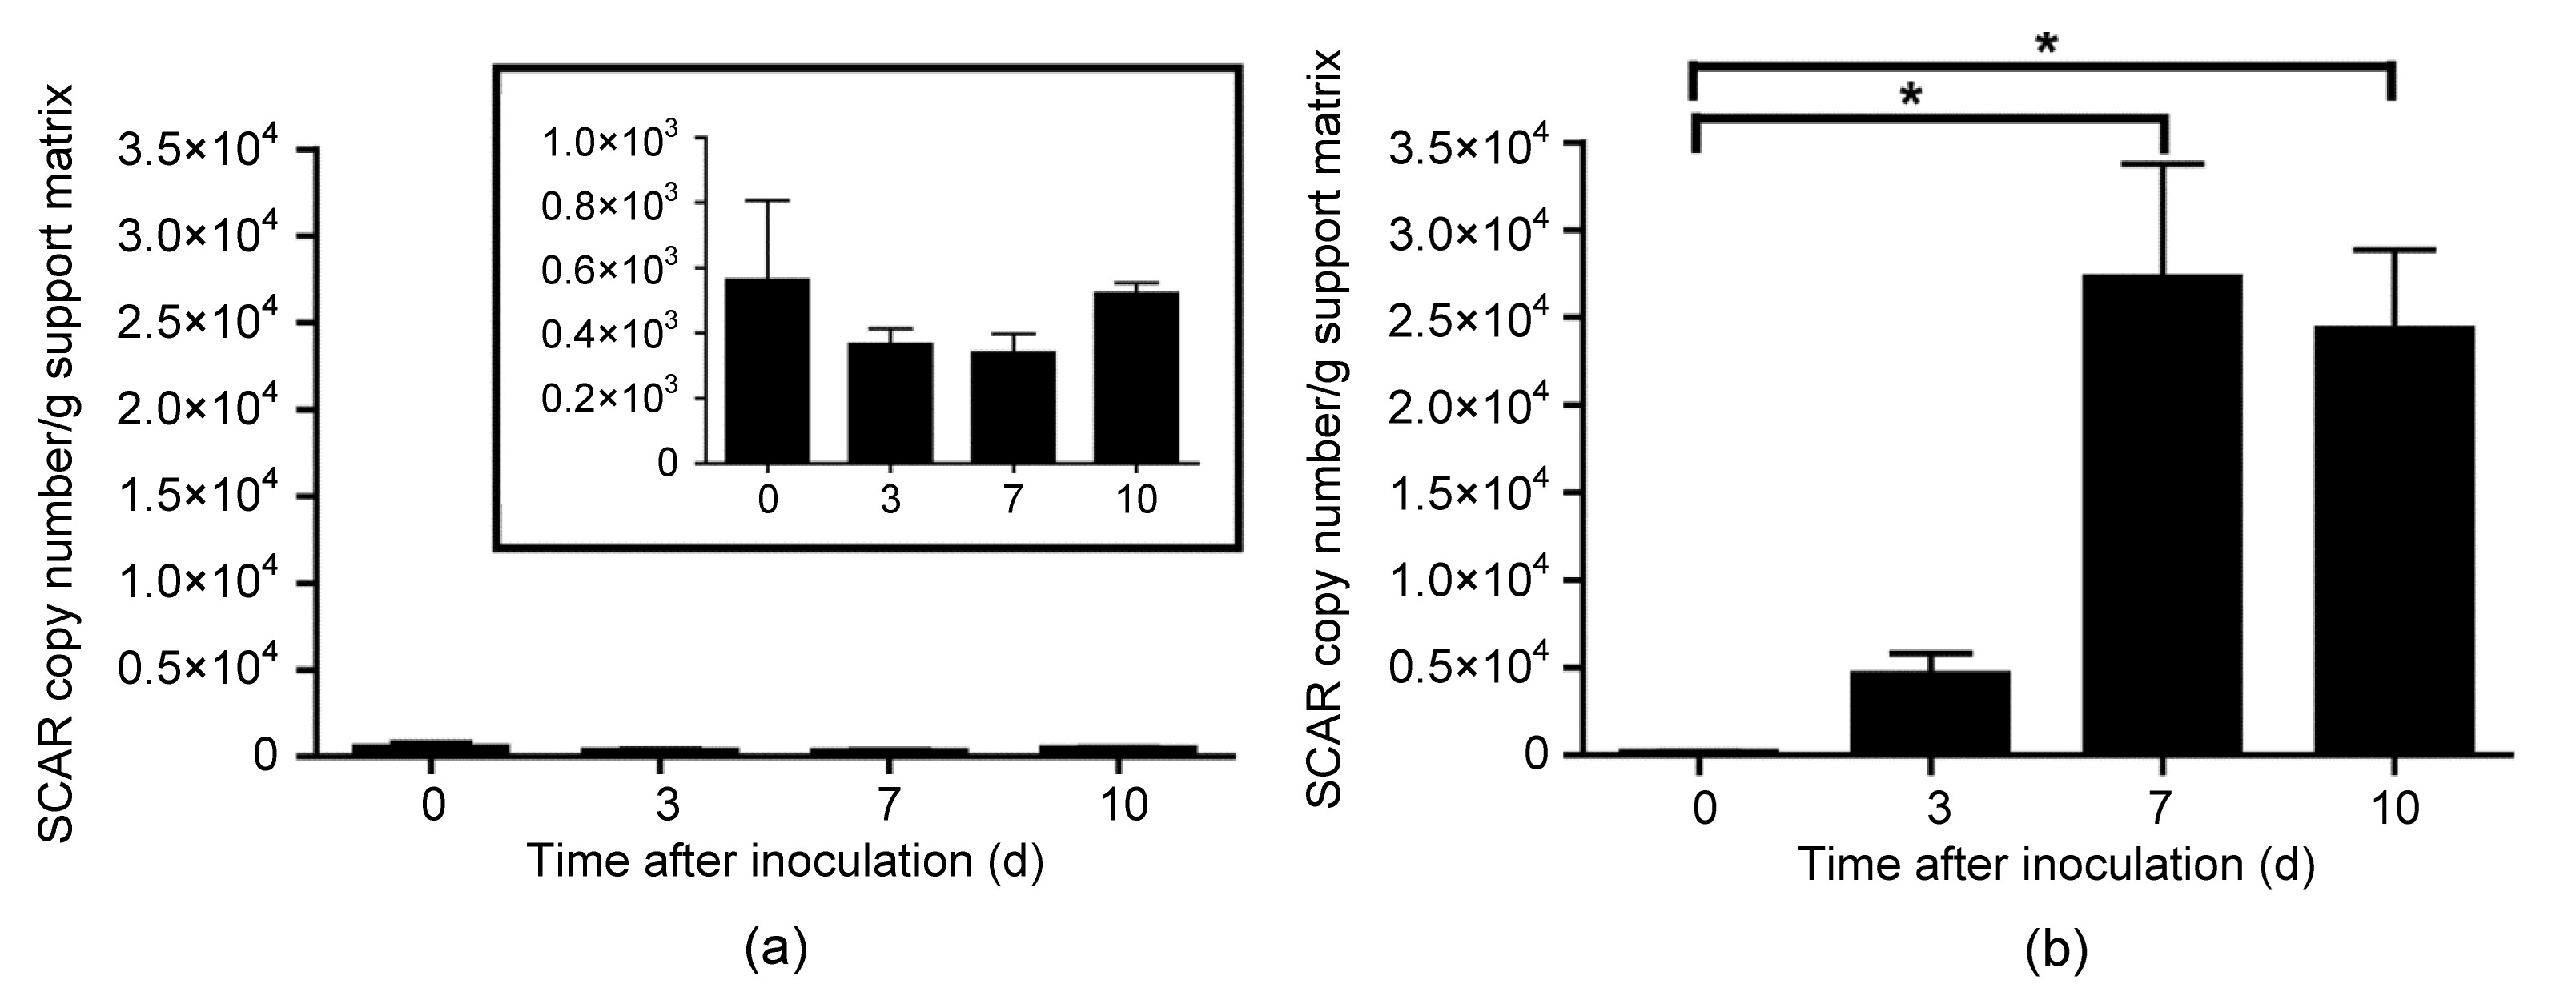
Finally, the SCAR marker sensibility was also assayed in the two experimental fungal communities. In both communities, T. cf. harzianum BpT10a was detected, but at 7 and 10 d after inoculation, respectively. The SCAR copy numbers in Community 2 were 100 times higher than those in Community 1 (Fig. 4). In this community context, when the DNA was extracted 2 h after the inoculation of spores from T. cf. harzianum BpT10a (0 d), the SCAR primers were only able to detect 1% of the expected SCAR copy numbers assuming that each spore contains one genome. In Community 1, the copy number showed no significant differences (P=0.5717) during the whole incubation time, indicating that the fungus is able to stay in this community, but not successfully colonize; in Community 2, the population of T. cf. harzianum significantly increased after 10 d of incubation (P=0.0189). No signals were detected in the control communities.
Fig.4
SCAR marker copy numbers in experimental fungal communities at the different sampling time
T. cf. harzianum was monitored by qPCR with the SCAR primers after inoculating it in two experimental fungal communities. (a) Community 1 composed of T. citrinoviride (BpTP), T. novaezelandiae (BpT1a), T. atroviride (Bpt10), B. bassiana (MR-21), and Purpureocillium sp. (MR-6); (b) Community 2 composed of P. canescens (MR-13), A. niger (MR-1), C. cladosporoides (MR-12), P. variotii (MR-9), and T. flavus (MR-25). Data are shown mean and standard deviation of duplicate measures. * represents significantly different values according to the Tukey HSD test (P≤0.05). The inset in the graph of Community 1 is included to show a higher resolution of the scale
4. Discussion
RAPD analysis has been a very useful fingerprinting technique for studying DNA polymorphisms in various organisms, among them fungal strains, although methodological difficulties such as reproducibility and co-dominance are some of the disadvantages associated with this method. To overcome this situation, RAPD assays can be made more robust by converting them into a PCR-based in more specific and reliable markers known as SCAR. These molecular markers facilitate the detection and monitoring process by being able to directly evaluate the presence of species, strains, or isolates in complex environmental samples or experimental microbial assemblages. In this work, an RAPD marker was converted into a SCAR marker to develop a sensitive and reliable assay for monitoring T. cf. harzianum in experimental fungal communities. Based on the sequence data of the cloned RAPD fragment, specific primer pairs were designed and evaluated to amplify SCAR markers. Two species-specific primer pairs, 2F2/2R2 and 2F2/2R3, amplified a 278-bp and 448-bp DNA fragment, respectively, when tested using the gDNA from various strains of T. cf. harzianum. The specificity of the SCAR primer pairs was empirically checked using DNA extracted from various fungal species and from fungal experimental communities as templates; T. cf. harzianum was distinguished from all the other tested Trichoderma species by generating the expected amplification product. The alignments of the SCAR marker sequences amplified with the 2F2/2R2 primer set from the tested T. cf. harzianum strains showed a high homology. Moreover, the SCAR sequence variability of T. cf. harzianum strains used in this study was similar to those of cal1 and tef1 genes according to the neighbor-joining (NJ) tree topologies.
The SCAR sequence was also compared with 366 fungal genomes, and no significant sequence homology was observed with fungi belonging to genera different to Trichoderma. In the Trichoderma group, six genomes were actually available, and no alignment was found with T. asperellum, T. atroviride, or T. longibrachiatum. In the case of the T. reesei and T. virens genomes, partial matches were detected, but these were not coincident with the areas where the primers were expected to anneal.
According to the sequence alignment data, this marker is present only once in the T. harzianum CBS 226.95 genome, therefore allowing it to assess a quantitative detection, by qPCR, of the number of genomic units present in a complex sample and to study the dynamics of a population of T. cf. harzianum in an experimental fungal community.
Although the SCAR marker designed in this study was not able to discriminate among different T. cf. harzianum strains, it is highly sensitive, with a detection limit of at least 100 genome copies per nanogram of total DNA, being more sensitive than other reported SCAR markers (Rubio et al., 2005; Cordier et al., 2007). In addition, this SCAR marker is sensible enough to detect T. cf. harzianum representing 0.1% in 1 ng of gDNA mix. This SCAR marker was also probed in fungal experimental communities, where the copy numbers determined by qPCR in a community composed of fungal species closely related to T. cf. harzianum BpT10a (Community 1) was not statistically different during the sampling time. Conversely, in Community 2, which comprised fungal species not as closely related to T. cf. harzianum BpT10a, its colonization was more successful, increasing the SCAR copy numbers from 7 d after inoculation. This result is in line with some previous studies and suggests that the composition of the recipient community affects the colonization by the alien fungus (Bae and Knudsen, 2001; 2005). Interactions, such as competition and amensalism, and the organic nutrient sources are reported to affect the populations and activities of biocontrol agents in the soil (Hoitink and Boehm, 1999). Moreover, in the experimental communities at 0 d after T. cf. harzianum BpT10a inoculation, the SCAR marker detected only 1% of the expected SCAR copy numbers, assuming that each spore in the inoculum contains one genome, which confirms that the DNA extraction methods for different sample types (spores, mycelia, support matrix, soil, etc.) could lead to underestimating the actual population of the fungus (Black and Foarde, 2007; Martin-Laurent et al., 2001).
SCAR markers derived from an RAPD assay have been used to detect different organisms at isolate or strain levels, such as Gliocladium catenulatum (Paavanen-Huhtala et al., 2000) and Fusarium oxysporum (del Mar Jiménez-Gascó and Jiménez-Díaz, 2003; Pasquali et al., 2006; Lievens et al., 2008). In addition, SCAR markers derived from an RAPD assay have been also previously reported and used to detect different Trichoderma species or strains in different samples with varying detection limits. Rubio et al. (2005) reported the specific detection, by means of a SCAR marker, of the T. harzianum 2413 strain both in a pure culture and an artificially inoculated sterile soil, but their specificity was not great enough to detect and quantify T. harzianum 2413 among a mixture of strains. Cordier et al. (2007) using a SCAR marker designed to specifically identify T. atroviride T1 strain monitored this strain in soil without cross-detection of other native populations of Trichoderma; the quantification of T. atroviride T1 by real-time PCR was possible at different fungal densities, even at the lowest concentration of 1×10³ colony-forming unit (CFU) per gram of soil. Feng et al. (2011), using SCAR markers, quantified two Trichoderma biocontrol strains in artificially inoculated sterile soils by multiplex qPCR, which were found at approximately 107–108 copies per gram of soil. SCAR markers have also been designed to detect Trichoderma at the genus level based in the ITS region sequence and used to detect and quantify Trichoderma spp. in different soils by real-time PCR (Hagn et al., 2007).
Other SCAR markers have been developed from sequences of endochitinase genes, for monitoring the biocontrol agent T. atroviride SC1 strain in field assays, with the detection limit 6×10³ haploid genome copies per gram of soil (Savazzini et al., 2008), and from intergenic regions using universal primer combinations to distinguish the T. harzianum AS12-2 strain, without detection limits evaluated (Naeimi et al., 2011).
The design carried out in the present study focused on obtaining a molecular marker useful for a wide range of T. cf. harzianum strains, then allowing the invasion and colonization processes of this fungal species. These markers may be useful not only for monitoring the effect of Trichoderma in experimental communities, but could be also used as a quality control system to confirm the identity of T. cf. harzianum in the industrially batch production of this fungus to market it as a biocontrol agent. SCAR-based real-time PCR has been successfully used to monitor biological control agents such as Aureobasidium pullulans L47 strain (Schena et al., 2002), Plectosphaerella cucumerina (Atkins et al., 2003), Candida oleophila (Massart et al., 2005), and Pseudomonas fluorescens (Pujol et al., 2005).
Eventually, these SCAR markers could be used to detect Trichoderma in environmental samples; however, since T. cf. harzianum is a cosmopolitan and diverse species, very frequent and abundant in soils, it is highly likely to find native strains very phylogenetically close to T. cf. harzianum, which could also be amplified with the designed primers. For this reason, this SCAR marker might not be useful for assessing the presence of T. cf. harzianum in environmental samples such as soil. In fact, it is very difficult to rule out cross-reactions with native strains not yet described and to discriminate between Trichoderma endogenous populations and those artificially inoculated, as has been reported by other authors in field trials (Feng et al., 2011). In any case, this SCAR marker can be used as a highly sensitive diagnostic tool, either by conventional PCR or qPCR, for tagging T. cf. harzianum populations in experimental fungal communities.
Acknowledgements
We appreciate the kindness of Mr. Pedro CASTILLO and Biopacific Co., Ltd. to facilitate the biological material. A careful and thorough review of the manuscript was provided by two anonymous reviewers; their constructive suggestions have strengthened the manuscript considerably and are appreciated. In addition, we are grateful to Dr. C. ZÚÑIGA (Faculty of Sciences, University of Chile) for the correction of the English language.
* Project supported by the Chilean National Fund for Scientific and Technological Development (FONDECYT) (No. 1120508)# Electronic supplementary materials: The online version of this article (http://dx.doi.org/10.1631/jzus.B1400063) contains supplementary materials, which are available to authorized usersCompliance with ethics guidelines Gabriel PÉREZ, Valentina VERDEJO, Clarissa GONDIM-PORTO, Julieta ORLANDO, and Margarita CARÚ declare that they have no conflict of interest.
References
[1] Altschul, S.F., Gish, W., Miller, W., 1990. Basic local alignment search tool.
J Mol Biol, 215(3):403-410.


[2] Arnedo-Andrs, M., Gil-Ortega, R., Luis-Arteaga, M., 2002. Development of RAPD and SCAR markers linked to the
Pvr4 locus for resistance to PVY in pepper (
Capsicum annuum L.).
Theor Appl Genet, 105(6-7):1067-1074.
[3] Atkins, S.D., Clark, I.M., Sosnowska, D., 2003. Detection and quantification of
Plectosphaerella cucumerina, a potential biological control agent of potato cyst nematodes, by using conventional PCR, real-time PCR, selective media, and baiting.
Appl Environ Microbiol, 69(8):4788-4793.
[4] Bae, Y.S., Knudsen, G.R., 2001. Influence of a fungus-feeding nematode on growth and biocontrol efficacy of
Trichoderma harzianum
.
Phytopathology, 91(3):301-306.
[5] Bae, Y.S., Knudsen, G.R., 2005. Soil microbial biomass influence on growth and biocontrol efficacy of
Trichoderma harzianum
.
Biol Control, 32(2):236-242.
[6] Bautista, R., Crespillo, R., Cnovas, F., 2003. Identification of olive-tree cultivars with SCAR markers.
Euphytica, 129(1):33-41.
[7] Bentez, T., Rincn, A.M., Limn, M.C., 2004. Biocontrol mechanisms of
Trichoderma strains.
Int Microbiol, 7:249-260.
[8] Benson, D.A., Cavanaugh, M., Clark, K., 2013. GenBank.
Nucl Acids Res, 41(D1):D36-D42.
[9] Black, J.A., Foarde, K.K., 2007. Comparison of four different methods for extraction of
Stachybotrys chartarum spore DNA and verification by real-time PCR.
J Microbiol Meth, 70(1):75-81.
[10] Castillo, P., 2009. Isolation and identification of strains of
Trichoderma sp. natives of Chile. Evaluation of antagonism against sp. Biologist Thesis. Catholic University of Valparaso,Chile :
[11] Cordier, C., Edel-Hermann, V., Martin-Laurent, F., 2007. SCAR-based real time PCR to identify a biocontrol strain (T1) of
Trichoderma atroviride and study its population dynamics in soils.
J Microbiol Meth, 68(1):60-68.
[12] del Mar Jimnez-Gasc, M., Jimnez-Diaz, R.M., 2003. Development of a specific PCR-based assay for the identification of
Fusarium oxysporum f. sp.
ciceris and its pathogenic races 0, 1A, 5, and 6.
Phytopathology, 93(2):200-209.
[13] Druzhinina, I.S., Kubicek, C.P., 2005. Species concepts and biodiversity in
Trichoderma and
Hypocrea: from aggregate species to species clusters?.
J Zhejiang Univ-Sci B, 6(2):100-112.
[14] Druzhinina, I.S., Kopchinskiy, A.G., Komn, M., 2005. An oligonucleotide barcode for species identification in
Trichoderma and
Hypocrea
.
Fung Genet Biol, 42(10):813-828.
[15] Druzhinina, I.S., Seild-Seiboth, V., Herrera-Estrella, A., 2011.
Trichoderma: the genomics of opportunistic success.
Nat Rev Microbiol, 9(10):749-759.
[16] Feng, X.M., Holmberg, A.I.J., Sundh, I., 2011. Specific SCAR markers and multiplex real-time PCR for quantification of two
Trichoderma biocontrol strains in environmental samples.
Biocontrol, 56(6):903-913.
[17] Gams, W., Bissett, J., 1998. Morphology and identification of
Trichoderma
.
and . Vol. 1. Basic Biology, Taxonomy and Genetics. Taylor & Francis,UK :3-34.
[18] Green, H., Jensen, D.F., 1995. A tool for monitoring
Trichoderma harzianum: II. The use of a GUS transformant for ecological studies in the rhizosphere.
Phytopathology, 85(11):1436-1440.
[19] Grondona, I., Hermosa, R., Tejada, M., 1997. Physiological and biochemical characterization of
Trichoderma harzianum, a biological control agent against soilborne fungal plant pathogens.
Appl Environ Microbiol, 63(8):3189-3198.
[20] Hagn, A., Wallisch, S., Radl, V., 2007. A new cultivation independent approach to detect and monitor common
Trichoderma species in soils.
J Microbiol Meth, 69(1):86-92.
[21] Harman, G.E., 2006. Overview of mechanisms and uses of
Trichoderma spp.
Phytopathology, 96(2):190-194.
[22] Harman, G.E., Howell, C.R., Viterbo, A., 2004.
Trichoderma species—opportunistic, avirulent plant symbionts.
Nat Rev Microbiol, 2(1):43-56.
[23] Hermosa, M.R., Grondona, I., Iturriaga, E.A., 2000. Molecular characterization and identification of biocontrol isolates of
Trichoderma spp.
Appl Environ Microbiol, 66(5):1890-1898.
[24] Hoitink, H.A.J., Boehm, M.J., 1999. Biocontrol within the context of soil microbial communities: a substrate-dependent phenomenon.
Annu Rev Phytopathol, 37(1):427-446.
[25] Jessup, C.M., Forde, S.E., Bohannan, B.J.M., 2005. Microbial experimental systems in ecology.
Advances in Ecological Research, Elsevier,37:273-307.
[26] Knudsen, I.M., Jensen, B., Jensen, D.F., 1996. Occurrence of
Gliocladium roseum on barley roots in sand and field soil. Monitoring Antagonistic Fungi Deliberately Released into the Environment. Springer,the Netherlands :33-37.
[27] Komon-Zelazowska, M., Bissett, J., Zafari, D., 2007. Genetically closely related but phenotypically divergent
Trichoderma species cause green mold disease in oyster mushroom farms worldwide.
Appl Environ Microbiol, 73(22):7415-7426.
[28] Koveza, O.V., Kokaeva, Z.G., Gostimsky, S.A., 2001. Creation of a SCAR marker in Pea (
Pisum sativum L.) using RAPD analysis.
Russ J Genet, 37(4):464-466.
[29] Kredics, L., Hatvani, L., Naeimi, S., 2014. Biodiversity of the genus
Hypocrea/Trichoderma in different habitats.
Biotechnology and Biology of
, Elsevier,:3-24.
[30] Kubicek, C.P., Komon-Zelazowska, M., Druzhinina, I.S., 2008. Fungal genus
Hypocrea/
Trichoderma: from barcodes to biodiversity.
J Zhejiang Univ-Sci B (Biomed & Biotechnol), 9(10):753-763.
[31] Lehmann, P.F., Lin, D., Lasker, B.A., 1992. Genotypic identification and characterization of species and strains within the genus
Candida by using random amplified polymorphic DNA.
J Clin Microbiol, 30(12):3249-3254.
[32] Lievens, B., Rep, M., Thomma, B.P.H.J., 2008. Recent developments in the molecular discrimination of formae speciales of
Fusarium oxysporum
.
Pest Manag Sci, 64(8):781-788.
[33] Martin-Laurent, F., Philippot, L., Hallet, S., 2001. DNA extraction from soils: old bias for new microbial diversity analysis methods.
Appl Environ Microbiol, 67(5):2354-2359.
[34] Massart, S., de Clercq, D., Salmon, M., 2005. Development of real-time PCR using Minor Groove Binding probe to monitor the biological control agent
Candida oleophila (strain O).
J Microbiol Meth, 60(1):73-82.
[35] Moore, J.C., Ruiter, P.C., Hunt, H.W., 1996. Microcosms and soil ecology: critical linkages between fields studies and modelling food webs.
Ecology, 77(3):694-705.
[36] Naeimi, S., Kocsub, S., Antal, Z., 2011. Strain-specific SCAR markers for the detection of
Trichoderma harzianum AS12-2, a biological control agent against
Rhizoctonia solani, the causal agent of rice sheath blight.
Acta Biol Hung, 62(1):73-84.
[37] Paavanen-Huhtala, S., Avikainen, H., Yli-Mattila, T., 2000. Development of strain-specific primers for a strain of
Gliocladium catenulatum used in biological control.
Eur J Plant Pathol, 106(2):187-198.
[38] Parasnis, A.S., Gupta, V.S., Tamhankar, S.A., 2000. A highly reliable sex diagnostic PCR assay for mass screening of papaya seedlings.
Mol Breed, 6(3):337-344.
[39] Pasquali, M., Piatti, P., Gullino, M.L., 2006. Development of a real-time polymerase chain reaction for the detection of
Fusarium oxysporum f. sp
basilici from basil seed and roots.
J Phytopathol, 154(10):632-636.
[40] Pujol, M., Badosa, E., Cabrefiga, J., 2005. Development of a strain-specific quantitative method for monitoring
Pseudomonas fluorescens EPS62e, a novel biocontrol agent of fire blight.
FEMS Microbiol Lett, 249(2):343-352.
[41] Rozen, S., Skaletsky, H., 1999. Primer3 on the WWW for general users and for biologist programmers.
Bioinformatics Methods and Protocols, Springer,:365-386.
[42] Rubio, M.B., Hermosa, M.R., Keck, E., 2005. Specific PCR assays for the detection and quantification of DNA from the biocontrol strain
Trichoderma harzianum 2413 in soil.
Microb Ecol, 49(1):25-33.
[43] Savazzini, F., Longa, C.M.O., Pertot, I., 2008. Real-time PCR for detection and quantification of the biocontrol agent
Trichoderma atroviride strain SC1 in soil.
J Microbiol Meth, 73(2):185-194.
[44] Savazzini, F., Oliveira Longa, C.M., Pertot, I., 2009. Impact of the biocontrol agent
Trichoderma atroviride SC1 on soil microbial communities of a vineyard in northern Italy.
Soil Biol Biochem, 41(7):1457-1465.
[45] Schena, L., Finetti-Sialer, M.M., Gallitelli, D., 2002. Molecular detection of strain L47 of
Aureobasidium pullulans, a biocontrol agent of postharvest disease.
Plant Dis, 86(1):54-60.
[46] Schuster, A., Schmoll, M., 2010. Biology and biotechnology of
Trichoderma
.
Appl Microbiol Biotechnol, 87(3):787-799.
[47] van der Putten, W.H., Klironomos, J.N., Wardle, D.A., 2007. Microbial ecology of biological invasions.
ISME J, 1(1):28-37.
[48] Vargas-Gil, S., Pastor, S., March, G.J., 2009. Quantitative isolation of biocontrol agents
Trichoderma spp.,
Gliocladium spp. and actinomycetes from soil with culture media.
Microbiol Res, 164(2):196-205.
[49] Viterbo, A., Haran, S., Friesem, D., 2001. Antifungal activity of a novel endochitinase gene (
chit36) from
Trichoderma harzianum Rifai TM.
FEMS Microbiol Lett, 200(2):169-174.
[50] White, T.J., Bruns, T., Lee, S.J., 1990. Amplification and direct sequencing of fungal ribosomal RNA genes for phylogenetics. PCR Protocols: a Guide to Methods and Applications. Academic Press,USA :315-322.
[51] Williams, J., Clarkson, J.M., Mills, P.R., 2003. A selective medium for quantitative reisolation of
Trichoderma harzianum from
Agaricus bisporus compost.
Appl Environ Microbiol, 69(7):4190-4191.
[52] Zhang, F., Zhu, Z., Yang, X., 2013.
Trichoderma harzianum T-E5 significantly affects cucumber root exudates and fungal community in the cucumber rhizosphere.
Appl Soil Ecol, 72:41-48.


Open peer comments: Debate/Discuss/Question/Opinion
<1>