Tian Yu, Fu-ling Guan, Lu Dai. Design and analysis of bidirectional deployable parabolic cylindrical antenna[J]. Journal of Zhejiang University Science A, 2014, 15(2): 83-96.
@article{title="Design and analysis of bidirectional deployable parabolic cylindrical antenna", author="Tian Yu, Fu-ling Guan, Lu Dai", journal="Journal of Zhejiang University Science A", volume="15", number="2", pages="83-96", year="2014", publisher="Zhejiang University Press & Springer", doi="10.1631/jzus.A1300202" }
%0 Journal Article %T Design and analysis of bidirectional deployable parabolic cylindrical antenna %A Tian Yu %A Fu-ling Guan %A Lu Dai %J Journal of Zhejiang University SCIENCE A %V 15 %N 2 %P 83-96 %@ 1673-565X %D 2014 %I Zhejiang University Press & Springer %DOI 10.1631/jzus.A1300202
TY - JOUR T1 - Design and analysis of bidirectional deployable parabolic cylindrical antenna A1 - Tian Yu A1 - Fu-ling Guan A1 - Lu Dai J0 - Journal of Zhejiang University Science A VL - 15 IS - 2 SP - 83 EP - 96 %@ 1673-565X Y1 - 2014 PB - Zhejiang University Press & Springer ER - DOI - 10.1631/jzus.A1300202
Abstract: A bidirectional deployable parabolic cylindrical reflector for an L-band synthetic aperture radar is presented in this study, in which a self-deployed antenna with low weight was designed. The antenna consists of four curved surfaces formed from thin sheets of composite materials connected by hinges along the edges, and the reflective surface is provided by the front surface. The edge profiles of connecting lines were obtained through geometric analysis. A scaled model, including design and manufacture, was demonstrated to validate the process from the folded state to the fully deployed state. The non-contact synchronous vision measuring method was used to test the basic frequency of the scaled model, and the test results gave the verification of the analyses. Compared with the existing unidirectional deployable antenna, this new type of bidirectional deployable antenna can be applied to larger-size antennas and has better performance because the glass-woven tape connections were substituted with more reliable hinges. Static, modal, harmonic response, and transient response analyses of the full-sized reflector structure were modeled with the commercial finite element (FE) package ABAQUS. The modeling techniques were developed to predict the structural dynamic behavior of the reflector and the results showed that the first natural frequency was 0.865 Hz, and the reflector structure had good stiffness in three directions. This proposed structure has very high stiffness-to-mass ratio because of its hollow solid construction. A preliminary simulation of radiation properties of the parabolic cylindrical antenna, fed by an off-set linear feed horn array, was conducted to obtain the radiation pattern of the feed and the reflector.
Ó ÓˋÑÓÛÓÿ¥ð¡¤ð¤ÍÛÓ¯ÕÕÒ§£ÐÕˋÝÍ´Ì¿Í¥ÓÛÍÓÍ₤ÍÝÍÊˋÓ¤¢ÿ¥Ìͤð¤Í¤ð¤ÍÊÍÌÌÓÍÍÍ₤ÍÝÍ¥ÐÌÑÌÂÓ̯ÍÌÝÓÑÌÓˋÕÂÍÊˋÓ¤¢Ðð£Í ð§ÍÌÐͤÕÂÌçÒ₤ð¡ÓÒÛ¤ÒÛÀÓÛÓÙÌ¿ÕÂÒÛ¤Ò₤ð¤Ò₤ËÓ£ÌͧÂÍ¥ÓÍ₤ÒÀÌÏÿ¥ð¡¤Ò¢ð¡ÌÙËÓͤӴÌð¡ð¤Í¤ÓÀÐ
Í̯ÒÎÓ¿ÿ¥Í¤ð¤ÍÌÀËÍÊÏÍÙÎÌͤÓDeployable Support Structureÿ¥Í¯ÍͯÕÂÍÌð¡ÊÍÍÛӯ̴ˆÍÌÍ ÿ¥Ò¢ð¡ÌÙËÍͯÌÑÌÂÓÑÌð¡Óð§ÓÏ₤ÿ¥ÕÓ´ÕÌËÒÏḬ̂ͥ̿ҢÒÀð¤Í¤ÕÂÌçÒ₤ÿ¥Ìͤð¤ÍÂÍ Ó£ÌÍÝÍ¥ÍÍͤÎÓÍ ÓÏÌ¿Ì°ÿ¥Ó£ÌÒÀ´ÌÍÂÍ ðƒÏÌ¢ÍÕÓ´large curved tape springs ð§ð¡¤Òƒ¿ÌÀÓÌ¿Í¥Ò§ÍÊÌÌÍÂÍ Ó£ÌÍͤÎÐ
Ó ÓˋÑÌ¿Ì°ÿ¥ÍÑð§ð¤ÍÊˋÓ¤¢Ó¥ˋÌ₤Ì´ÀÍÿ¥ÕˆÒ₤ð¤ÌÑÌÂð¡ÍÝÍ¥Ò¢Ó´ÿ¥ÕÓ´ÕÌËÒÏÎÍ¥ÌͧÝÌçÕÌ°Ò¢ÒÀð¤Í¤ÕÂÌçÒ₤ÿ¥ÕÓ´ÌÕÍ Ì¿Ì°Ò¢ÒÀð¤Í¤ÕÂÍÌÐÍ´ÍÍͤÍÌÍÕÍÍÌÿ¥ÍÌÑÍÌÙËÍÌð¤ÓçÌÏÒ§Ð
ÕÒÎÓ£ÒÛ¤ÿ¥Ì˜ÌÍÛÓ¯ð¤ð¡ÓÏð§ÕÕÐð§Ì̘ÓÍÍÍ₤ÍÝÌÝÓÑÌÓˋÕÂÍÊˋÓ¤¢Ó£ÌͧÂÍ¥ÿ¥Ò§ÍÊÍÛӯ҃ͯÓÌÑÓ¤°ð§ÓÏ₤ÿ¥Ìð¡ÙÌͤÓÍ Í¤Ì¿ÌÀÒ§ÍÊÌÌÌÕ¨Ó£ÌÓͤÕÂÐÕÌËÒÏÎÍ¥ÌçÕÌ¿Ì°Í₤¿ð¤Ò¢ÓÝ£ÕÂÓÒƒð§ÓÌÌÏÓ£ÌÌ₤Í₤ÒÀÓÐ
Í °ÕÛÒ₤ÿ¥Í₤ÍÝÓ£Ìÿ¥ÌÝÓÑÌÓˋÕÂÍÊˋÓ¤¢ÿ¥ÕÂÓÌçÒ₤ÿ¥Ó£ÌÍÌÿ¥ÒƒÍ¯Ì´ÀÍ¥
Darkslateblue:Affiliate; Royal Blue:Author; Turquoise:Article
Article Content
1. Introduction
Deployable techniques have been applied to many space structures, such as solar sails, masts, and antennas which have small-stowed volumes before accurately deploying to predetermined shape in orbit. Deployable antennas are an essential element of future space technology. The maximum diameter of launch vehicles limits the diameter of the satellite to about 4 m, but antennas larger than this are required for earth observation, astronomy, and communications. Deployable antennas can be split into two wide categories, those with a flexible reflector surface and those with a solid reflector surface. Flexible antennas are antennas where the surface itself can be folded. When deployed, the reflector surface is stretched out to the required shape. The flexible antennas are much preferred for relatively large deployable reflectors.
Demand for the materials for space structures is increasing sharply and in recent years composite materials have been applied to deployable antennas. Seffen and Pellegrino (1999) studied the mechanical properties of tape springs made by carbon fiber reinforced plastic (CFRP). A novel deployable support structure (Soykasap and Pellegrino, 2004) was proposed through the combination of CFRP thin sheets and tape springs (Fig. 1). Technical support was provided for the application of composite materials in the foldable structures by studying the folding of composite structures (Yee and Pellegrino, 2005). Soykasap (2007) analyzed the folding design of composite structures. Later, curved large tape springs were applied to an ultra-thin shell deployable reflector (Soykasap et al., 2012). The dynamics of an elastically deployable solar array made by the combination of CFRP sheets and tape springs was analyzed and validated through the ground test model (Jorgensen et al., 2005). Marks et al. (2002) designed and analyzed a lightweight deployable antenna for the Mars advanced radar for subsurface and ionospheric sounding (MARSIS) experiment on the Mars express spacecraft. Mobrem and Adams (2006) conducted the analysis of the lenticular jointed MARSIS antenna deployment. National Aeronautics and Space Administration (NASA) developed new modeling and analysis techniques for predicting the structural dynamic behavior of the next generation space telescope (NGST) sunshield (Johnston and Lienard, 2001), and carried out ground tests (Lienard et al., 2001) in a vacuum environment to characterize the structural dynamic behavior of a one-tenth scale model of the sunshield. The test results were used to validate analytical modeling techniques that could be used in conjunction with scaling laws (Greschik et al., 2000) to predict the performance of the full-sized structure.
Fig.1 Deployable support structure (Soykasap and Pellegrino, 2004)
Traditional deployable truss structures which consist of many struts and kinematic pairs need a complex driven system. This drawback can be compensated for the composite materials’ advantages of lightweight and self-driven mechanism. The deployable support structure (Soykasap and Pellegrino, 2004), connected by flexible hinges made with woven-glass tapes along the edges, consists of four curved thin CFRP sheets as shown in Fig. 1. The front surface of the hollow solid provides the reflective surface. The structure has a very high stiffness-to-mass ratio because of its thin-walled box-type construction.
2. Structural concept and cutting pattern
2.1. Structural concept
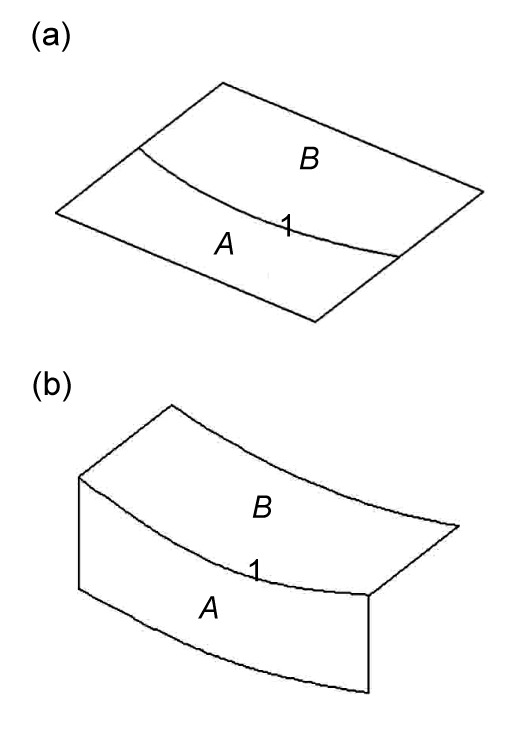
A flat sheet A with a curved edge 1 is connected by flexible hinges to a coplanar flat sheet B with a matching curved edge (Fig. 2a). By rotating sheet A through 90°, both sheets become curved (Fig. 2b).
Fig.2 Folded (a) and deployed (b) configurations
The hollow solid structure (Fig. 3a) is made by connecting four pairs of structures, all identical to the one shown in Fig. 2b, through four identical curved edges. The shape of the hollow solid formed by the four curved sheets is determined by the connecting curves between the sheets. The planar structure (Fig. 3b) is obtained by introducing folding lines along the middle lines 2 and 3. The bending radius r is determined by the minimum bending radius of the CFRP considering a safety factor. In other words, the maximum strain imposed by the folding process has to be smaller than a threshold value determined by the properties of the CFRP sheet.
Fig.3 Hollow solid (a) and planar structure (b)
The required reflective surface is obtained by an extension of sheet B (Fig. 3a), to a rectangular sheet (Fig. 4). Note that A′ and B′ are identical to A and B in Fig. 3 respectively, because of the symmetry.
Fig.4 Hollow solid structure with reflective surface
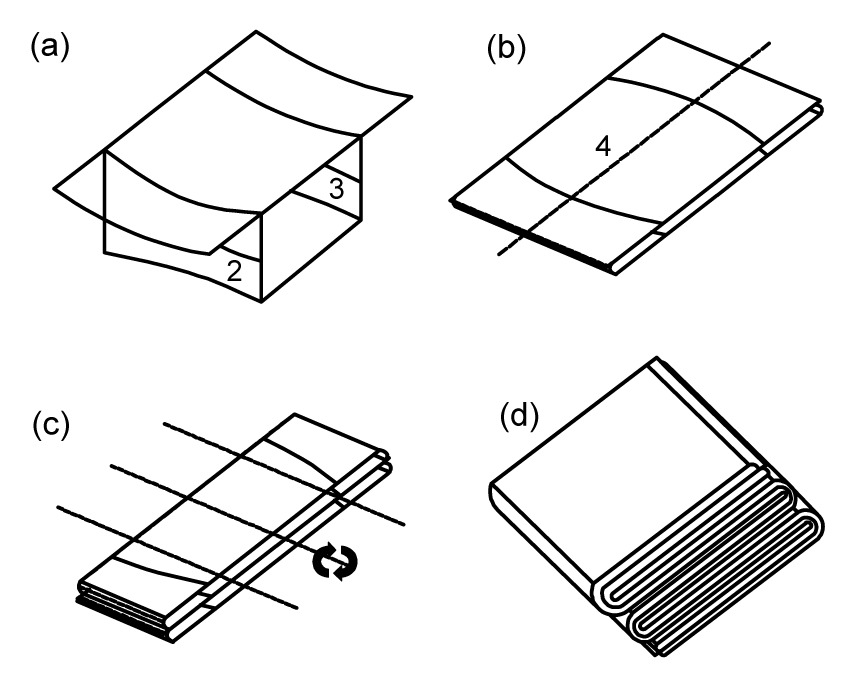
The folding process consists of firstly flattening the structure, then introducing one transverse fold, and finally applying three longitudinal folds. The folding is shown in Fig. 5. The folded structure shown in Fig. 5d is obtained by firstly bending outward the side walls 180° along lines 2 and 3 (leading to the structure in Fig. 5b), and then by applying one transverse fold and three longitudinal folds (leading to the structures shown in Figs. 5c and 5d, respectively).
The transverse fold is obtained by dividing the reflective surface into two equal parts connected by torsion springs. Cut-outs in the side walls are required to reduce the maximum strain and prevent the failure of the material in the region where two fold lines are crossing.
2.2. Cutting pattern
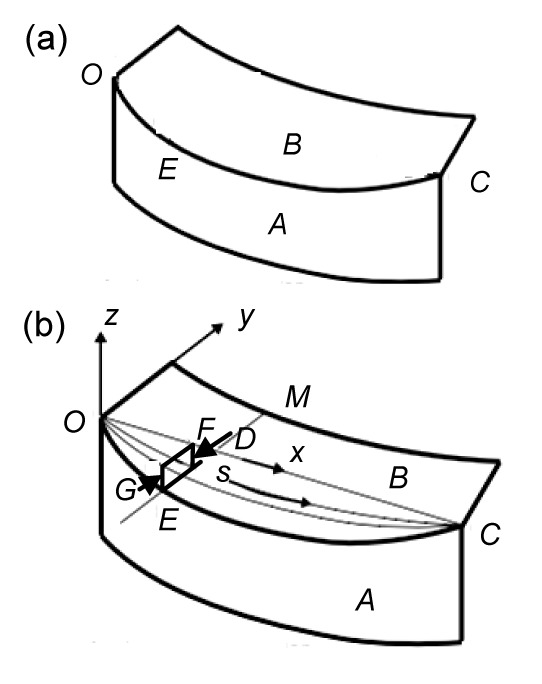
Fig. 6a shows two cylindrical surfaces, A and B, which intersect along the 3D curve OEC. Surface B can be generated by considering the 2D curve z=d(x), and by translating this curve along EM, paralleling to the y-axis as shown in Fig. 6b. D is a general point on z=d(x), and the x-axis starts at the origin O and passes through the end point C of the curve. F and G are the projections of D and E onto the x-y plane. Curved line s is the projection of the x-axis onto the curved surface B.
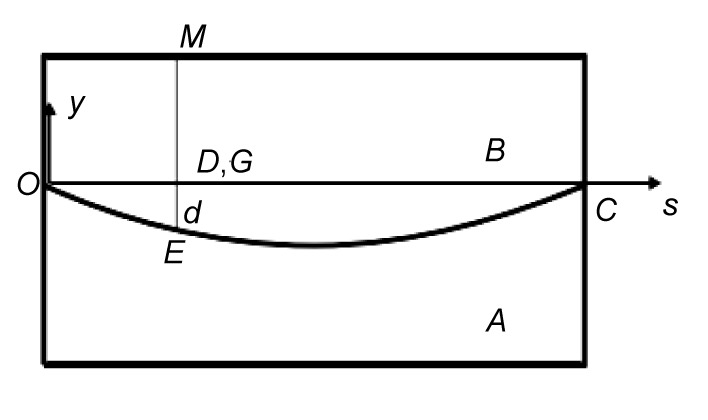
The edge profile can be obtained by firstly determining the arc-length s(x) along the curve and then determining d(s) (Fig. 7). If d(s) cannot be found explicitly, then an implicit description in terms of s(x) and d(x) can be used instead.
Fig.7 Folded configuration
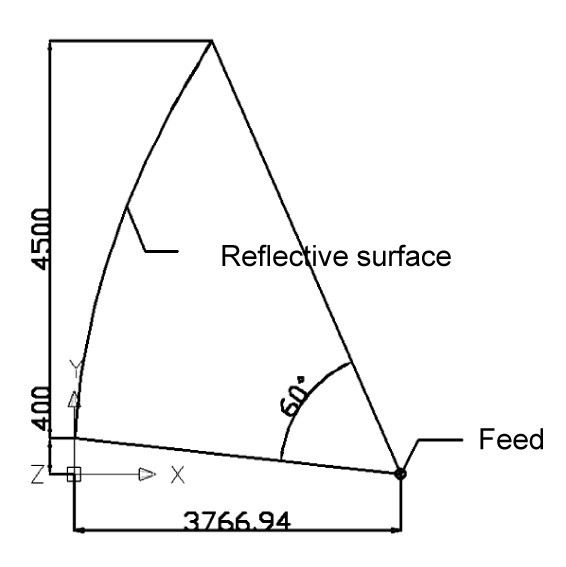
Considering an offset parabolic reflective surface (Fig. 8), the equation of the parabola with vertex at (0, 0) is given by y2=4ax, where a is the focal distance. The cutting pattern defined by s(x) and d(x) can be calculated from (Soykasap and Pellegrino, 2004).
,
,
where a0=(y0xf−x0yf)/(xf−x0) and a1=(yf−y0)/(xf−x0) with (x0, y0) and (xf, yf) being the start and end points of the parabola, respectively (Fig. 8).
Fig.8 Profile of reflective surface (mm)
The size of the fully deployed and folded parabolic antenna in this study is 8300 mm×4500 mm×0.3 mm and 2075 mm×2413.1 mm×h mm respectively, where 0.3 is the material thickness, and the final height h of the reflector in the folded configuration is determined by the minimum bending radius of the material. The cutting pattern for the flat sheets is shown in Fig. 9.
Fig.9 Cutting pattern of the reflector structure (a) Reflective surface; (b) Side surface; (c) Back surface
3. Driving mechanism and model validation
3.1. Driving mechanism
When the reflector is preparing to deploy in orbit, the folded antenna is connected to the spacecraft bus by a truss structure, which would be deployed before the deployment of the reflector.
The deployment is obtained by sequentially cutting the restraints. Firstly, the fully folded structure, driven by the self-stored strain energy, deploys longitudinally by releasing longitudinal restrains. Next, by releasing the transverse restrains, the reflector is driven by torsion springs to deploy transversely. Finally, once the first two stages of the deployment process have been completed, the side walls driven by the self-stored strain energy and tape springs are allowed to unfold to separate the reflective surface from the back surface.
3.2. Model validation
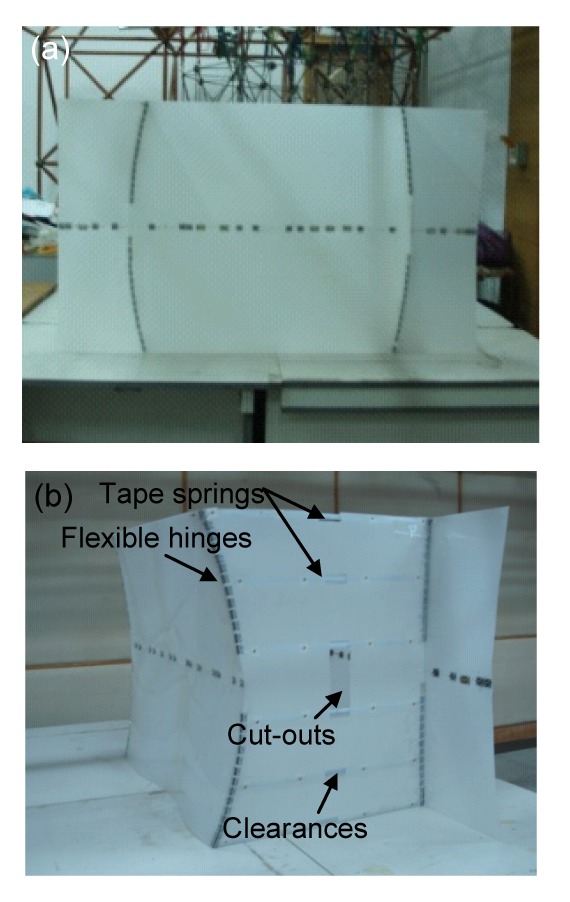
A 1719 mm×1000 mm×1 mm model made with polypropylene (PP) sheets that can be tested in the laboratory considering the gravity compensation, was designed and constructed (Fig. 10). The reflective surface was divided into two equal parts connected by torsion springs. Four curved sheets were connected by flexible hinges along the edges to form the hollow solid structure. To attach the tape springs to the sidewalls, plastic washers with one side flat and the other side curved were used. Note that each side wall has one cut-out and four clearances; the former is designed to reduce the high strains resulting from the cross-over of the longitudinal and transverse hinge lines when the structure is folded, and the latter is designed to enable the tape springs to bend freely.
Fig.10 Scaled model reflector (a) Scaled model; (b) Connections and cut-outs
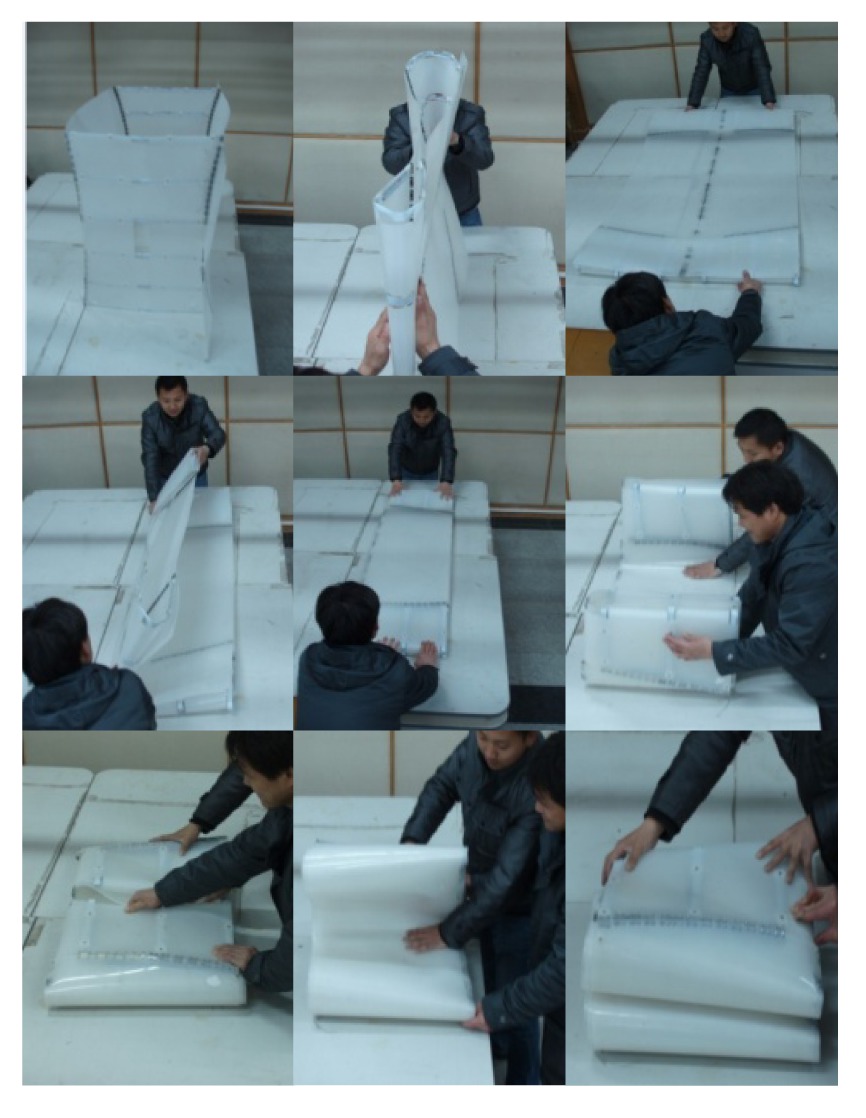
The folding sequence is shown in Fig. 11. The ground test model was attached to a steel support structure to stimulate the connection between the reflector and spacecraft bus in orbit (Fig. 12). The structure was then deployed under quasi-static conditions, in three stages, with gravity compensation through a suspension system (Jorgensen et al., 2005).
Fig.11 Folding sequence, from top left to bottom right
Fig.12 Deployment sequence, from top left to bottom right
4. Frequency analysis and test of the scaled model
4.1. Frequency analysis
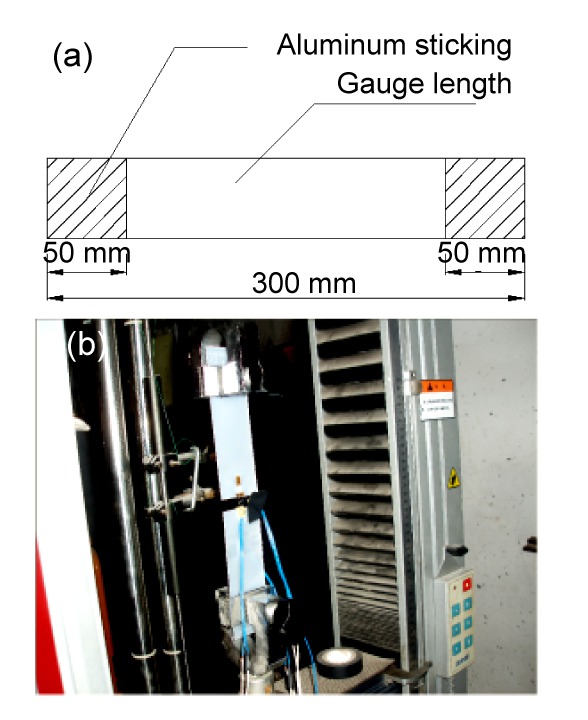
The material property of the PP sheets, with 1 mm uniform thickness, was obtained by tensile test (Fig. 13). The specimen size is 300 mm×50 mm×1 mm and gauge length is 200 mm. The test results show that, the Poisson’s ratio and elastic modulus of the PP sheets is 0.35 and 850 MPa, respectively.
Fig.13 Material tensile test (a) Test specimen; (b) Tensile test
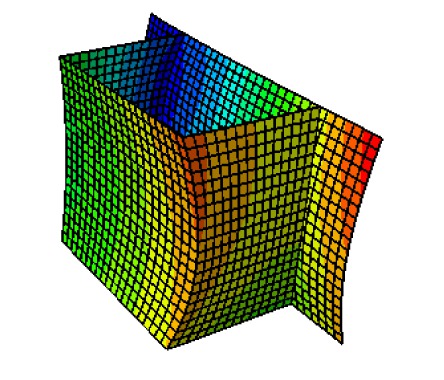
The scaled reflector structure was modeled with the ABAQUS finite element program to study the static and dynamic responses of the structure in the deployed configuration. First, a parabolic cylinder was created by translation of the offset parabola profile. Then, the concave and convex surfaces were obtained by cutting the parabolic cylinder with another parabolic cylinder perpendicular to the first one. The support structure is thus a closed hollow solid, and both translational and rotational degrees of freedom were tied together along the connections. Some parts of the reflective surface are assumed to be edgewise pinned to stimulate connection between the reflector and steel support structure. Results show that the frequency of the first natural vibration mode (Fig. 14) is 0.440 32 Hz.
Fig.14 First vibration mode
4.2. Frequency test
A non-contact synchronous vision measuring method (Zhang, 1999), based on the binocular video measuring theory, was used to test the basic frequency of this structure. The relation between the pixel and world coordinates was obtained by triangulation theory. The vibration period of the structure can be calculated by relating the space coordinates and time coordinates.
,
,
where [u, v]T denotes the pixel coordinates, and [x, y, z]T denotes the space coordinates of the collecting points. Rc∈ and Tc∈ are the rotational and translational matrices, respectively. fc1, fc2, cc1, and cc2 are the intrinsic parameters of the two cameras: focal length and principle point, respectively. s1 and s2 are unknown parameters. The cameras’ matrixes were obtained by merging and simplifying their intrinsic and extrinsic parameters. The equation can be summarized as
,
where ul, vl, ur, and vr are the pixel coordinates of the photos taken by left and right cameras, respectively. Li,j (Ri,j) represents the (i, j)th entry of matrix L (R).
Two cameras are applied to track the observing point in real time. The extrinsic and intrinsic parameters of the cameras were obtained by dividing the videos into photos and using the MATLAB camera calibration toolbox (Tsai, 1987) to process these photos. In the experiment, the angle between the two cameras was about 90°. The observing point, as shown in Fig. 15, should satisfy that the two cameras can capture the selected point simultaneously and clearly.
Fig.15 Video collecting of the vibration
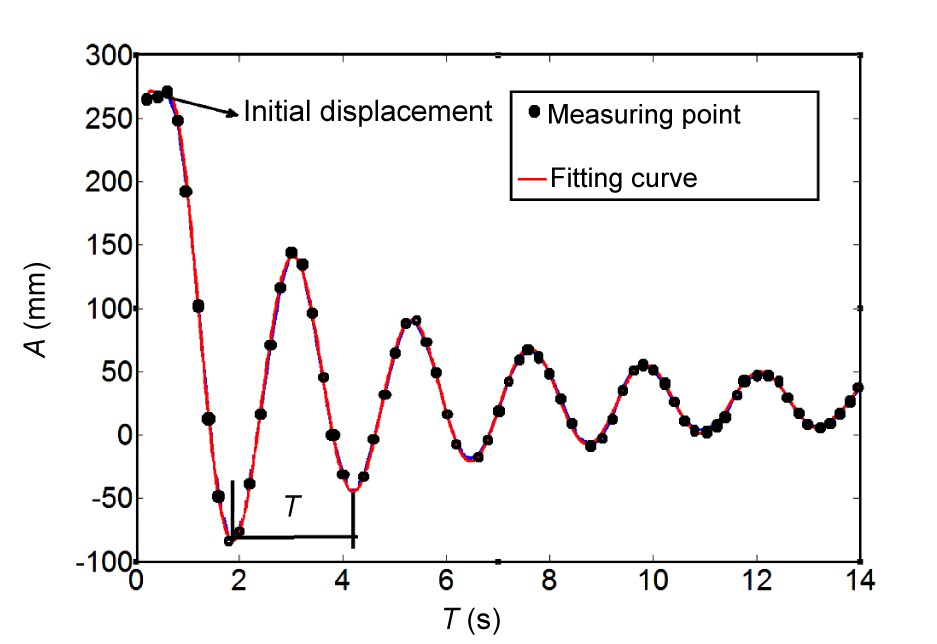
The finite element analysis (FEA) results show that the first vibration mode of the reflector was the free end’s to-and-fro movement around the fixed end. Thus, an initial displacement along the direction based on the FEA results was applied to the free end of the structure in the experiment. Then the vibration of the reflector was caused by suddenly removing the displacement load. The observing point’s vibration information was recorded by two cameras simultaneously and was processed by methods mentioned above to obtain the relation between the space coordinate of the observing point and time. The vibration fitting curve was obtained through the least square fitting method, as shown in Fig. 16, where T is the time and A is the vibration amplitude of the observing point.
Fig.16 Fitting curve of the vibration points
The basic frequency of the reflector by FEA is 0.440 32 Hz, and is in good agreement with the measurement’s result, i.e., 0.434 78 Hz, indicating the feasibility of FEA.
5. Structural analysis of full-sized reflector
A full-scale reflector structure was analyzed in ABAQUS to study the dynamic and static responses. The geometry of this structure is defined as an exact full-scale replica of the reflector defined in Section 2.2. Several stiffness improving methods were designed to reduce the maximum deflection and to increase the fundamental natural frequency, including adding ribs to the reflector surface, adding two more side walls, increasing the sheets’ thickness, and adding large curved tape springs as the rim of the reflector. Considering the total mass, first natural frequency, deploying and folding of the reflector, it is finally concluded that adding side walls and large curved tape springs are the two reasonable methods to optimize the reflector.
5.1. Modeling and analysis of structural dynamics
The following sections discuss the modeling and analysis of the full-scale model reflector dynamics, including the FE model, analysis procedures, and results from modal, harmonic, and transient response analyses.
5.1.1. Modal analysis
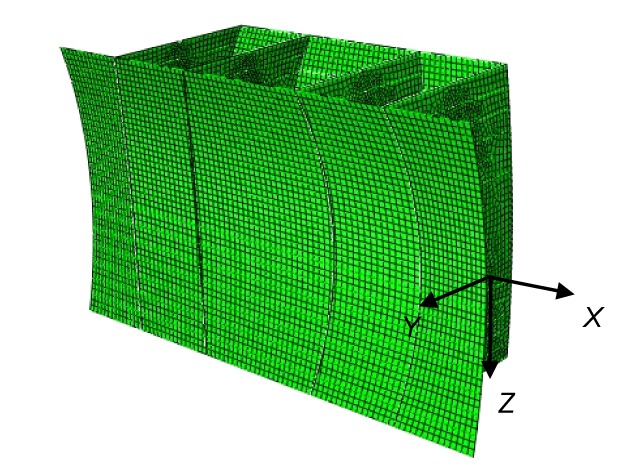
The modal analysis determines the natural frequencies and mode shapes for the structure. The full-scale model was modeled in ABAQUS with the reflector size of 8300 mm×4500 mm×0.3 mm in deployed state, and symmetric side walls with an end height of 2.8 m. The material was based on carbon fiber reinforced plastic with properties (Soykasap, and Pellegrino, 2004) E1=E2=50.4 GPa, G12=19.2 GPa, ν12=0.316, and ρ=1560 kg/m3, where E1, E2, ν12, and ρ are the elastic modulus, shear modulus, Poisson’s ratio, and density of the CFRP, respectively. The sheets were modeled with four-node fully integrated shell elements with an approximate element size of 100 mm. The FE model for the full-sized reflector is presented in Fig. 17.
Fig.17 Finite element model
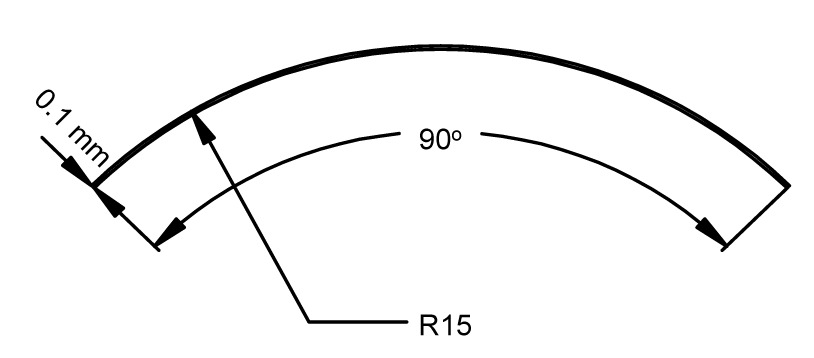
Steel tape springs with a thickness of 0.1 mm and a transverse radius of curvature of 15 mm were riveted to the sidewalls, to increase the deployment moment and the stiffness of the sidewalls in the deployed configuration. Their cross-section is shown in Fig. 18. The principal second moments of area are Ixx=3.5882 mm4 and Iyy=81.9893 mm4.
Fig.18 Cross-section of a tape spring
The cross-sectional area is 2.2354 mm2. The material properties are assumed to be E=207 GPa, G=79 GPa, ν=0.3, and ρ=7800 kg/m3, where E and G are the elastic and shear modulus, respectively, and ρ is the density of the tape springs. The tape springs are modeled as beams with general cross-section in ABAQUS.
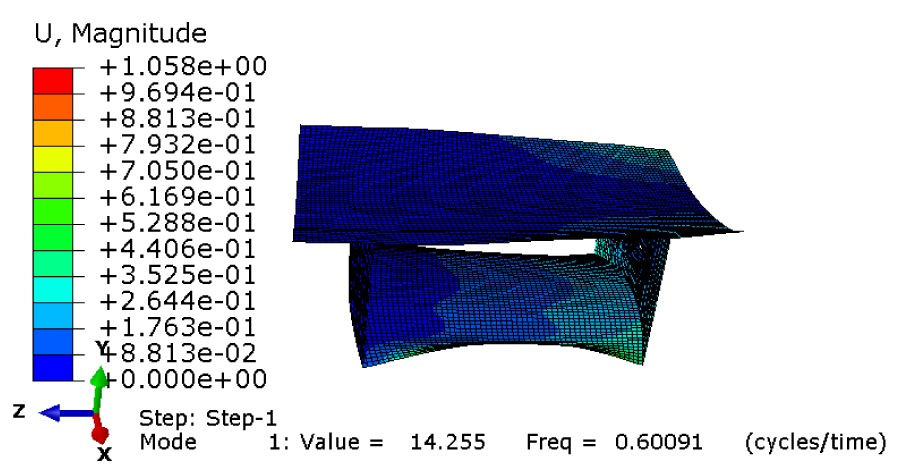
The free end of the reflective surface is edgewise pinned. The first natural vibration mode with a frequency of 0.60 Hz is shown in Fig. 19.
Fig.19 First vibration mode of initial model
The structure was reinforced in the following five schemes.
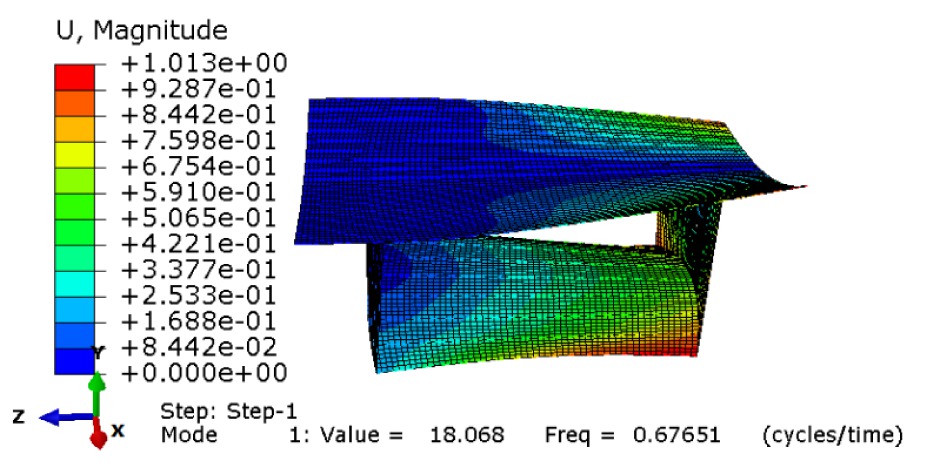
In the first scheme, a series of stiffeners (ribs) based on the same material CFRP are added to the reflector and back surface. They are evenly distributed over the reflective surface and back surface at 300 mm and 603 mm spacing, respectively and have an L-shaped cross-section of 20 mm×20 mm×0.5 mm. The fundamental natural frequency is slightly increased to 0.6765 Hz and the first vibration mode is shown in Fig. 20.
Fig.20 First vibration mode of model with stiffeners
Adding two more sidewalls, 1.6 m inward from the existing ones, is the second reinforcement scheme. The fundamental natural frequency is increased to 0.7125 Hz (Fig. 21).
Fig.21 First vibration mode of model with two more sidewalls
In the third scheme, the fundamental natural frequency is increased to 0.7846 Hz by adding ribs and two more sidewalls simultaneously.
Scheme 4 is based on scheme 3. By increasing the thickness of the sheets to 0.5 mm, the fundamental natural frequency is increased to 0.8217 Hz.
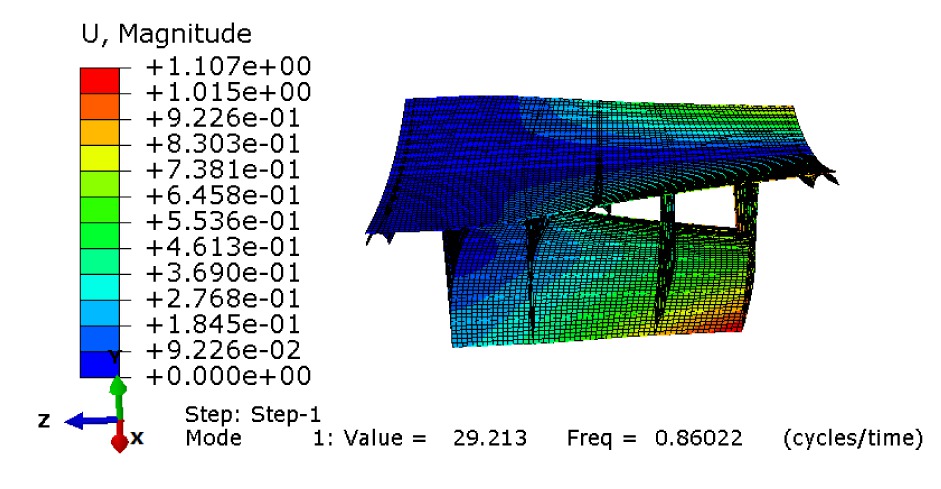
In scheme 5, three curved large tape springs based on the same material with the reflector are evenly added to the reflective surface as the rim and support of the reflector. Their cross-section with a thickness of 2 mm and a radius of curvature of 212 mm is shown in Fig. 22. The tape springs were meshed in shell elements and were tied to the internal surface of the reflective. The fundamental natural frequency is 0.860 Hz and the first vibration mode is shown in Fig. 23.
Fig.22 Cross-section of a curved tape spring
Fig.23 First vibration mode with curved large tape springs
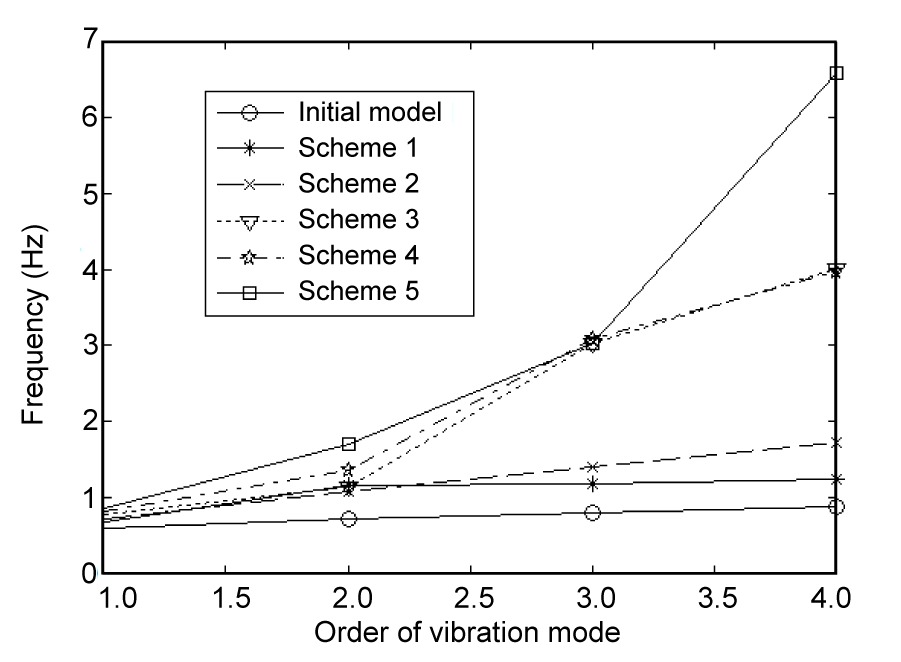
The first four frequencies of the five schemes are shown in Fig. 24. While the other three frequencies have significant improvements, the fundamental natural frequencies are slightly increased by 12.71%, 18.71%, 30.72%, 36.90%, and 43.32%, respectively. Considering the total mass, the first natural frequency, and deployment and folding of the reflector, adding side walls and large curved tape springs are two reasonable methods to optimize the reflector. Table 1 presents a summary of the first ten natural frequencies of the deployed reflector.
Fig.24 First four frequencies of different reinforcement schemes
Table 1
Summary of the first ten natural frequencies
Mode
Frequency (Hz)
Mode
Frequency (Hz)
1
0.8602
6
7.2906
2
1.7074
7
7.5501
3
3.0308
8
7.8763
4
6.5788
9
7.9930
5
6.9432
10
8.3308
5.1.2. Harmonic response analysis
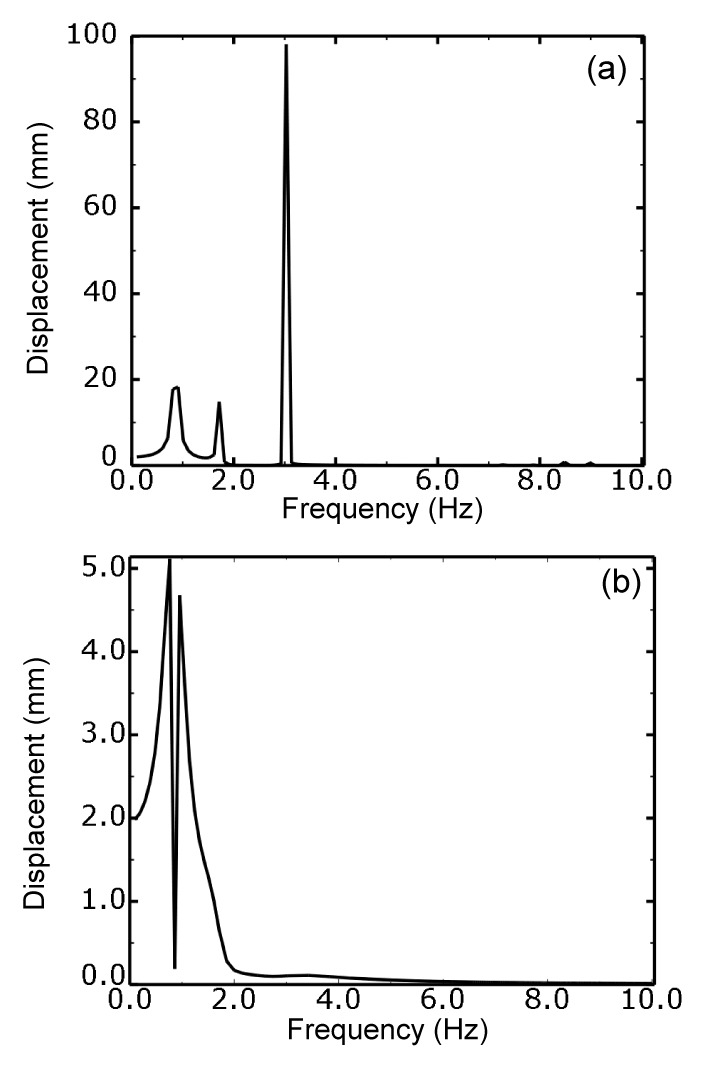
The frequency response analysis is used to predict the response of the reflector to random excitation. The Steady State Dynamics, Subspace Projection option of ABAQUS is used to analyze the steady response of the structure subjected to harmonic excitation. All of the excitations are due to a harmonic load of 10 N in the Y direction, which is applied to node 1. The frequency is swept from 0–10 Hz. The modes that are used for the subspace projection are computed in a frequency step prior to the subspace analysis being performed. In the frequency step the first 20 frequencies are extracted for which the computed values range from 0.86 Hz to 11.09 Hz. Nodes 1–3 are used as observation nodes (Fig. 25). The damping ratio ζ is included in the analysis using values of 0 and 0.05, respectively. Frequency responses of the three nodes are shown in Figs. 26–28, respectively.
Fig.25 Positions of three observation nodes
Fig.26 Frequency response of node 1 from a harmonic excitation under ζ=0 (a) and ζ=0.05 (b)
Fig.27 Frequency response of node 2 from a harmonic excitation under ζ=0 (a) and ζ=0.05 (b)
Fig.28 Frequency response of node 3 from a harmonic excitation under ζ=0 (a) and ζ=0.05 (b)
All the frequency responses show similar results in terms of the frequency of the peaks. The analyses predict strong peaks at 0.86, 1.71, and 3.0 Hz, which are the first three natural frequencies of the reflector. The major differences are that the predicted responses show smaller results in terms of the amplitude and frequency of peaks when structural damping is taken into consideration.
5.1.3. Transient response analysis
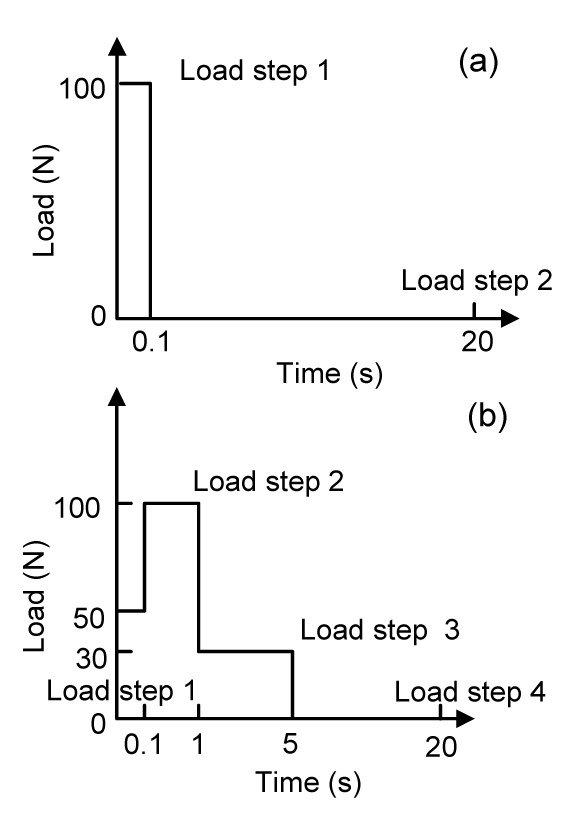
The transient response analysis is a time-domain calculation of the dynamic response of the structure, and is used to predict the response of the reflector to impulse excitation. Time-dependent excitation profiles are applied to the structure. The transient response analysis was completed using the modal dynamic product in ABAQUS to simulate the impact response of the reflector to the space debris and meteorites. Transient modal dynamic analysis gives the response of the model as a function of time based on a given time-dependent loading. The structure’s response is based on a subset of the modes of the system, which must first be extracted using the frequency extraction procedure. The modal amplitudes are integrated through time, and the response is synthesized from these modal responses. The number of modes extracted must be sufficient to model the dynamic response of the system adequately, and the number of modes included in this solution has been found by trial, and finally the first 30 modes are extracted. Modal damping is included in the analysis using values of 0.03 and 0.05, respectively. Concentrated force in the Y direction is applied to node 1 as a step function. The time histories of two loading conditions are shown in Fig. 29.
Fig.29 Impulse history under single step (a) and multiple steps (b)
The appropriateness of the modal dynamic method’s application in this case is demonstrated by a relatively simple load condition. The objective of this preliminary analysis is to calculate the displacement due to a force dynamically applied to the antenna. The force is applied in the Y direction of node 1 as a step function of 10 N, and the first 30 modes are extracted in the frequency step prior to the modal dynamic analysis. The displacement history of node 1 in the Y direction is shown in Fig. 30b, and the predicted steady-state displacement is 6.21 mm, which agrees well with the Abaqus/Standard’s result of 6.31 mm (Fig. 30a).
Fig.30 Comparisons between Abaqus/Standard analysis (a) and modal dynamic analysis (b) (ζ=0.05) in Y direction
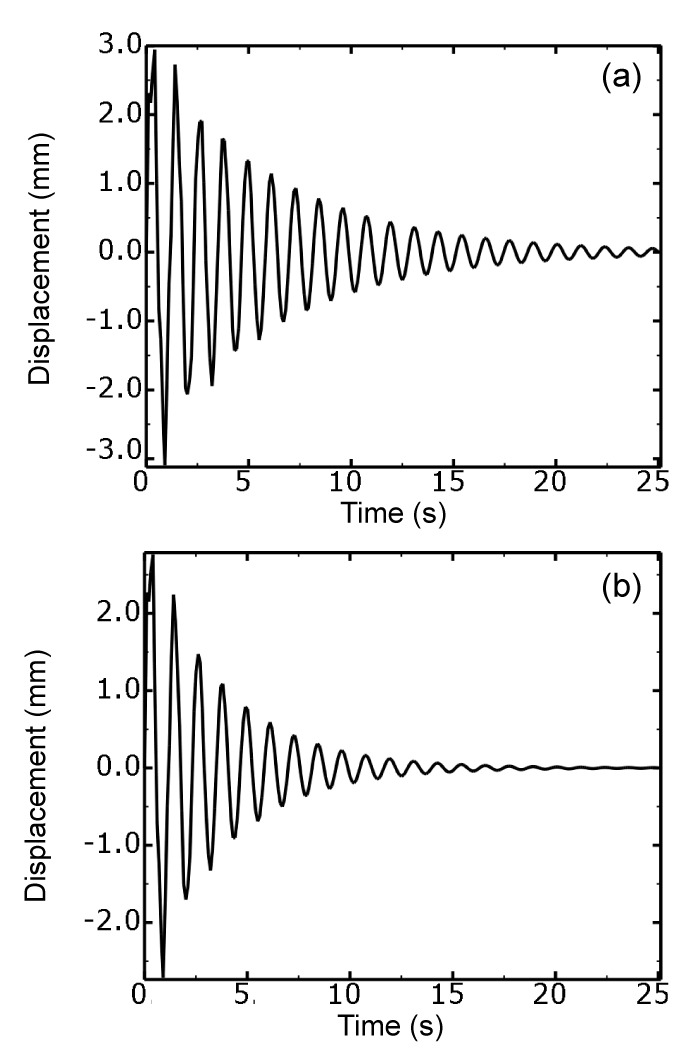
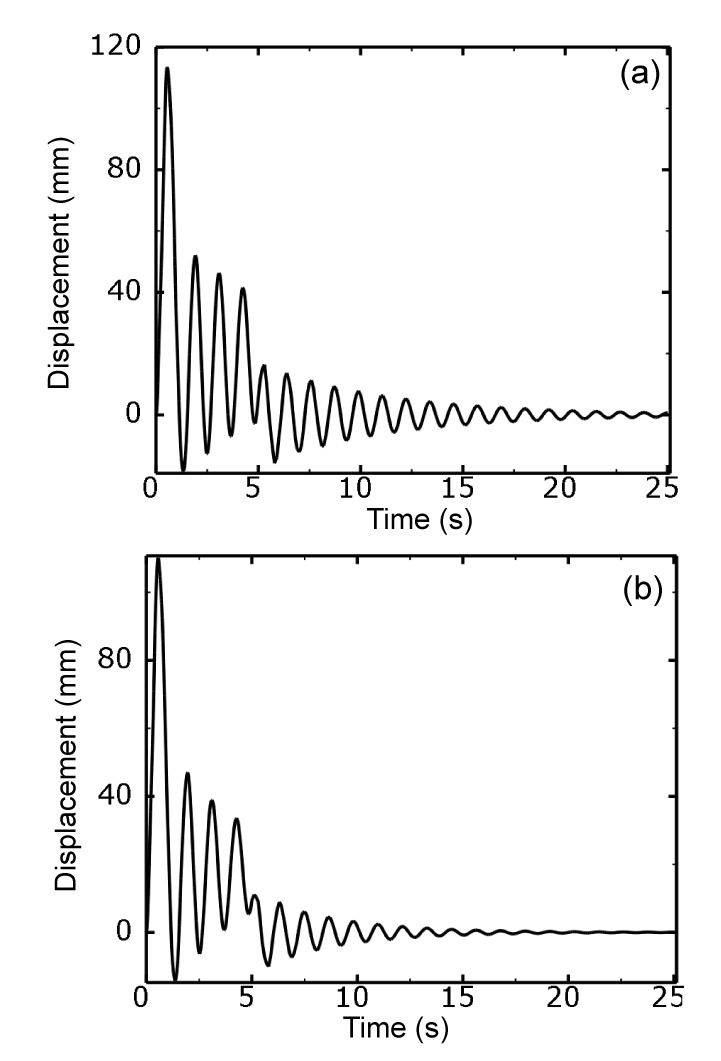
Figs. 31 and 32 present the impact response of the reflector to the impulse excitation of a single load step and multi-load steps in the time domain, respectively.
Fig.31 Impact response of node 1 from single step under ζ=0.03 (a) and ζ=0.05 (b) in Y direction
Fig.32 Impact response of node 1 from multiple steps under ζ=0.03 (a) and ζ=0.05 (b) in Y direction
5.2. Static analysis
Displacement analysis of the free end of the structure was carried out in the deployed configuration from an ABAQUS linear-static analysis. Unit static loads in the out-of-plane, transverse, and longitudinal directions were applied to the free end of the reflector structure, respectively (Fig. 33), by concentrated force in ABAQUS.
Fig.33 Static analysis model
In the out-of-plane direction, unit load was applied to the free end along the y-axis. The maximum displacement is 4.961 mm, occurring in the load point, and the structural deformations are mainly close to the load point.
In the longitudinal direction, unit load was applied to the free end along the x-axis. The maximum displacement is 0.0156 mm.
In the transverse direction, unit load was applied to the free end along the z-axis. The maximum displacement is 0.129 mm.
The results show that the out-of-plane stiffness of the structure is the lowest because of the very small stiffness of the flexible thin sheet in the out-of-plane direction, but displacement is mainly concentrated on the loading point. The stiffness in the other two directions is very good.
6. Simulation of the radiation properties
This part describes the simulation of the electrically large parabolic antenna, at 2 GHz, fed by an off-set linear feed array (LFA) (Eom et al., 2011). The linear feed array consists of 15 horn antennas. Horizontal polarization is applied to the antenna system. The reflector system is shown in Fig. 34.
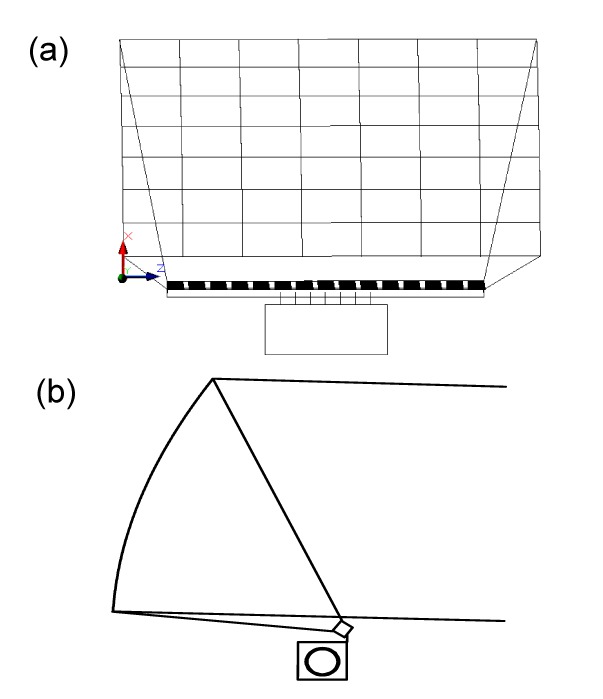
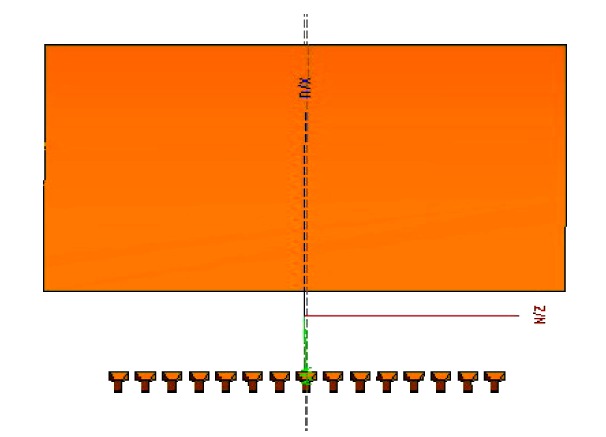
Fig.34 Illustration of an LFA and parabolic cylindrical reflector under front view (a) and side view (b)
The single radiating element of the LFA is shown in Fig. 35. The rectangular horn is excited with a waveguide port. The LFA is arranged linearly in the longitudinal direction with 15 radiating elements. As the distance between the array elements is 117.1 mm (0.78λ), the length of the entire LFA is about 6300 mm. The phase centre of the FEA should be situated along the focal length of the reflector.
Fig.35 Radiation element excited with a waveguide port: Geometry of the horn antenna (w1=310.7 mm, h1=224.4 mm, w=117.7 mm, h=58.8 mm, l=224.8 mm, and l1=92.1 mm)
The design of an LFA fed parabolic cylindrical reflector involves many design parameters. Two considerations are very important when placing an LFA at the focal length of the reflector (Eom et al., 2011). First, the LFA radiation pattern should be concentrated on the reflector surface to reduce spillover and have the desired edge taper. Second, the LFA should be designed to reduce the blockage, hence the gain, of the antenna. Spillover and edge taper is typically handled through LFA design, and blockage is remedied through an offset reflector. This study only conducted preliminary simulation to obtain the radiation properties of the parabolic cylindrical antenna.
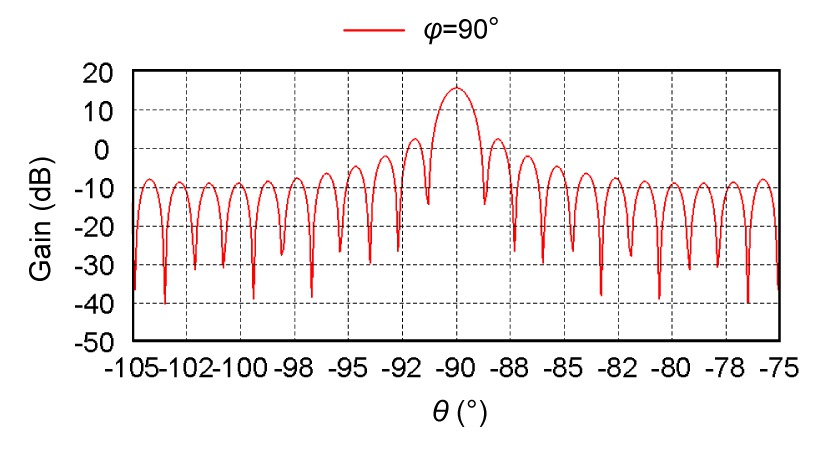
Modeling of the 2 GHz horn antenna array was performed using the commercially available electromagnetic simulation software FEKO. The multilevel fast multipole method (MLFMM) is applied to this LFA system. The radiation pattern of the LFA is shown in Fig. 36. Total gain of the LFA is 14.5 dB.
Fig.36 Gain of linear feed array antenna
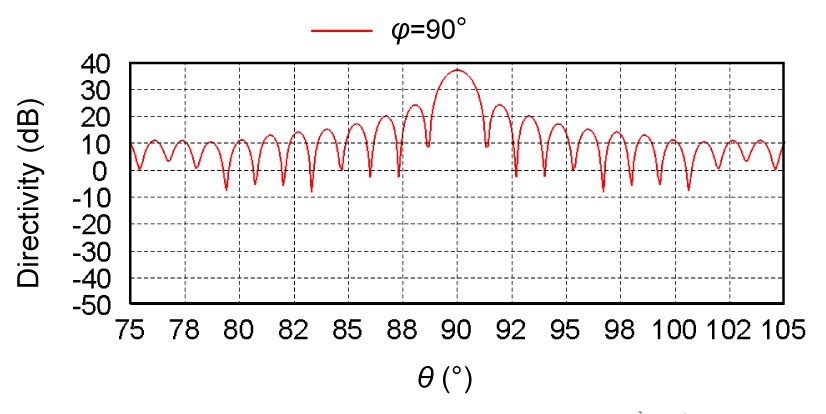
For the simulation of the LFA with the parabolic reflector, the MLFMM is also implemented, since the electrical size of the problem is very large. The reflector antenna model is shown in Fig. 37 and the simulation results are shown graphically in Fig. 38. The total gain of the antenna system is 37.11 dB.
Fig.37 Model of the LFA fed reflector antenna
Fig.38 Radiation pattern of reflector
7. Conclusions
Based on the deployable support structure proposed by Soykasap and Pellegrino (2004), a bidirectional deployable parabolic cylindrical antenna was designed and analyzed. This concept can deliver a parabolic profile of high accuracy with a structure of very low mass, high stiffness, and potentially very low cost. The size of the reflector in the folded configuration can be reduced to half of the existing scheme because of its bidirectional folding. The performance of the connections, made with hinges, is better than the existing schemes’ connections made with woven-glass tape. A displacement-adjustable hinge aimed at fine-tuning the connections in deployed configuration, is under study, to improve the precision of the antenna reflective surface. A scaled model, made of PP sheets, was designed and constructed. This model has been used to validate the deployment and folding process of the reflector. The non-contact synchronous vision measuring method was used to test the basic frequency of the scaled model, and the test results match the analyses very well. The dynamic and static responses of the structure, in the deployed configuration, were modeled with the ABAQUS FE program. Modal analyses were performed to predict the frequencies and mode shapes of the reflector, and transient response analyses were completed to simulate the impact response from space debris and micrometeorites. The basic natural frequency was increased to 0.865 Hz by adding two sidewalls and curved tape springs to improve the stiffness of the reflector, which is very good in the three directions.
Ground testing of the dynamic response information is needed in future work to provide data to validate modeling results for the reflector. The influence of gravity and ambient air should be considered, which can be obtained through empirical data taken in both ambient and vacuum conditions.
Further studies are needed, to design a constraint system for the folded structure which can be automatically released during the deployment. Deployment kinematic analysis is also required to study the dynamic response of the structure in the deploying process.
References
[1] Eom, S.Y., Jung, Y.B., Ganin, S.A., 2011. A cylindrical shaped-reflector antenna with a linear feed array for shaping complex beam patterns. Progress in Electromagnetics Research, 119:477-495.
[2] Greschik, G., Mikulas, M.M., Freeland, R.E., 2000. Scaling of nonlinear phenomena with emphasis on thin film deployable structures. IUTAM-IASS Symposium on Deployable Structures: Theory and Applications. Springer Netherlands,the Netherlands 80:127-136.
[3] Johnston, J., Lienard, S., 2001. Modeling and analysis of structural dynamics for a one-tenth scale model NGST sunshield. , 42nd AIAA/ASME/ASCE/AHS/ASC Structures, Structural Dynamics, and Materials Conference, Seattle, USA, 16-19. :16-19.
[4] Jorgensen, J., Louis, E.L., Hinkle, J.D., 2005. Dynamics of an elastically deployable solar array: ground test model validation. , 46th AIAA/ASME/ASCE/AHS/ASC Structures, Structural Dynamics, and Materials Conference, Austin, USA, 1-14. :1-14.
[5] Lienard, S., Johnston, J., Ross, B., 2001. Dynamic testing of a subscale sunshield for the next generation space telescope (NGST). , 42nd AIAA/ASME/ASCE/AHS/ASC Structures, Structural Dynamics, and Materials Conference, Seattle, USA, :
[6] Marks, G.W., Reilly, M.T., Huff, R.L., 2002. The lightweight deployable antenna for the MARSIS experiment on the Mars express spacecraft. , Proceedings of the 36th Aerospace Mechanisms Symposium, Glenn Research Center, Cleveland, USA, 183-196. :183-196.
[7] Mobrem, M., Adams, D.S., 2006. Analysis of the lenticular jointed MARSIS antenna deployment. , 47th AIAA/ASME/ASCE/AHS/ASC Structures, Structural Dynamics, and Materials Conference, Newport, USA, :
[8] Seffen, K.A., Pellegrino, S., 1999. Deployment dynamics of tape springs. Proceedings of the Royal Society of London Series A: Mathematical, Physical and Engineering Sciences, 455(1983):1003-1048.
[10] Soykasap, ., Pellegrino, S., 2004. Deployable Synthetic Aperture Radar Reflector. CUED/D-STRUCT/TR209, Department of Engineering, University of Cambridge,:
[11] Soykasap, ., Karakaya, é.., Trkmen, D., 2012. Curved large tape springs for an ultra-thin shell deployable reflector. Journal of Reinforced Plastics and Composites, 31(10):691-703.
[12] Tsai, R.Y., 1987. A versatile camera calibration technique for high-accuracy 3D machine vision metrology using off-the-shelf TV cameras and lenses. IEEE Journal of Robotics and Automation, 3(4):323-344.
[13] Yee, J.C.H., Pellegrino, S., 2005. Folding of woven composite structures. Composites Part A: Applied Science and Manufacturing, 36(2):273-278.
[14] Zhang, Z.Y., 1999. Flexible camera calibration by viewing a plane from unknown orientation. Proceedings of the 7th IEEE International Conference on Computer Vision, Kerkyra, Greece, 1:666-673.
Open peer comments: Debate/Discuss/Question/Opinion


Open peer comments: Debate/Discuss/Question/Opinion
<1>