Affiliation(s):
1.
School of Materials Sciences and Engineering, Shenyang Aerospace University, Shenyang 110034, China; moreAffiliation(s): 1.
School of Materials Sciences and Engineering, Shenyang Aerospace University, Shenyang 110034, China; 2.
Department of Materials and Optoelectronic Science, National Sun Yat-Sen University, Taiwan 804, Kaohsiung; 3.
Department of Materials Engineering, Kun Shan University, Taiwan 710, Tainan; less
X.H. Du, Y.C. Chang, H.J. Pei, B.Y. Chen, M.C. Kuo, J.C. Huang. Coating behavior and surface hardening of Pd77Cu6Si17 thin film metallic glass on AZ31 magnesium alloy[J]. Journal of Zhejiang University Science A, 2013, 14(12): 898-905.
@article{title="Coating behavior and surface hardening of Pd77Cu6Si17 thin film metallic glass on AZ31 magnesium alloy", author="X.H. Du, Y.C. Chang, H.J. Pei, B.Y. Chen, M.C. Kuo, J.C. Huang", journal="Journal of Zhejiang University Science A", volume="14", number="12", pages="898-905", year="2013", publisher="Zhejiang University Press & Springer", doi="10.1631/jzus.A1300246" }
%0 Journal Article %T Coating behavior and surface hardening of Pd77Cu6Si17 thin film metallic glass on AZ31 magnesium alloy %A X.H. Du %A Y.C. Chang %A H.J. Pei %A B.Y. Chen %A M.C. Kuo %A J.C. Huang %J Journal of Zhejiang University SCIENCE A %V 14 %N 12 %P 898-905 %@ 1673-565X %D 2013 %I Zhejiang University Press & Springer %DOI 10.1631/jzus.A1300246
TY - JOUR T1 - Coating behavior and surface hardening of Pd77Cu6Si17 thin film metallic glass on AZ31 magnesium alloy A1 - X.H. Du A1 - Y.C. Chang A1 - H.J. Pei A1 - B.Y. Chen A1 - M.C. Kuo A1 - J.C. Huang J0 - Journal of Zhejiang University Science A VL - 14 IS - 12 SP - 898 EP - 905 %@ 1673-565X Y1 - 2013 PB - Zhejiang University Press & Springer ER - DOI - 10.1631/jzus.A1300246
Abstract: Pd77Cu6Si17 (PCS) thin film metallic glasses (TFMGs) with high glass forming ability and hardness were selected as a hard coating for improving the surface hardness of AZ31 magnesium alloy. Both microindentation and nanoindentation tests were conducted on specimens with various PCS film thicknesses from 30 to 2000 nm. The apparent hardness and the relative indentation depth (β) were integrated using a quantitative model. The interaction parameters involved and relative hardness values were extracted from iterative calculations. According to the results, surface hardness can be enhanced greatly by PCS TFMGs in the shallow region, followed by gradual decrease with increasing β ratio. In addition, specimens with thinner coatings (e.g., 200 nm) showed greater substrate-film interaction and those with thick coatings (e.g., 2000 nm) became prone to film cracking. The optimum TFMG coating thickness in this study was estimated to be around 200 nm.
Darkslateblue:Affiliate; Royal Blue:Author; Turquoise:Article
Article Content
1. Introduction
In response to the industrial need to develop high strength materials with light weight, Mg alloys have attracted increasing interest due to their excellent strength to weight ratio among all structural materials. A Mg sheet can be effective in shielding electro-magnetic waves (Kojima, 2000). Moreover, the good casting ability of Mg alloys makes them easier to be die-cast into complicated shapes. Mg alloys can also be reused and recycled through re-melting procedures. However, Mg alloys have presented challenging problems such as unsatisfactory corrosion and wear resistance, and insufficient hardness and strength, which might restrict their broad application in engineering. Extensive efforts have been devoted to improving their stubborn weak nature (Ferkel and Mordike, 2001; Gray and Luan, 2002). One effective method is to apply a protective hard coating to the surface. An appropriate coating layer on a Mg surface can improve resistance to corrosion and wear.
Metallic glasses (MGs) have been developed over recent decades. Amorphization of metallic material can result in unique physical and mechanical properties, such as high elastic energy, high yield strength and hardness, low Young’s modulus, good wear resistance, and reasonable corrosion resistance (Johnson, 1998; Inoue, 2000; Inoue et al., 2003; Wang et al., 2004). Recently, MGs have been regarded as potentially useful materials which can be used in the form of a thin film coating on various substrates, in an attempt to strengthen the substrate. Due to the absence of dislocations and grain boundaries, thin film metallic glasses (TFMGs) with an amorphous structure exhibit superior mechanical properties. They can also be employed to enhance hardness and wear resistance. TFMGs deposited on samples can make their surfaces much smoother. Unlike ceramic thin films which have a stubborn brittle nature, some TFMGs even show slight ductility. The combination of the above properties makes TFMGs attractive for many applications, including electronic, medical, and surface coating applications. The use of ternary and multi-component TFMGs as protective coatings for both functional and structural applications has been investigated by Inoue et al. (1991).
Among the various processes for fabricating TFMGs, sputtering is considered to be the most promising route, giving easy control of TFMG composition and amorphous structure. For instance, the ternary and quaternary TFMGs, Pd-Cu-Si (Hata et al., 2001), Zr-Cu-Al (Hata et al., 1999), and Zr-Cu-Al-Ni (Chu et al., 2004), were successfully prepared via alloy sputtering. Such Pd- and Zr-based TFMGs exhibit high corrosion resistance (Pang et al., 2001). Ternary Pd-Cu-Si alloy systems, especially for Pd77Cu6Si17 (PCS) (Yao et al., 2007), also have inherently high glass forming ability and relatively ductile behavior.
Based on the above considerations, PCS TFMG was selected for the current study for coating Mg alloys. Microhardness and nanoindentation tests were conducted on AZ31 alloys with PCS-TFMG coatings. The effect of different coating thicknesses was analyzed to explore the optimum coating thickness for hardening the substrate. According to the concept of Tuck et al. (2001), a hardness model can be developed from several variables and extended into a generalized form. The enhancement achieved by TFMG coatings of different penetration depths can be evaluated and compared using an accurate hardness model.
2. Materials and methods
AZ31 magnesium alloy wrought plates with an average composition of 3.02% Al, 1.01% Zn, and 0.30% Mn by weight were selected as the substrate in this study. Mechanical grinding and polishing treatments were applied to the AZ31 substrate to ensure a smooth surface. PCS alloy coatings were deposited on the smooth AZ31 substrates by a single-gun magnetron sputtering system using the PCS alloy target. The main chamber was pumped down to a base pressure of less than 1.33×10⁻⁴ Pa by a cryo-pump. The PCS alloy target was located on a direct current (DC) gun with a power of 200 W, and pure argon atmosphere as the working gas was maintained at a rate of 30 standard cubic centimeters per min (sccm). The substrate was rotated at an average speed of 10 r/min to ensure a uniform film thickness. The working distance between the holder and the DC gun was 120 mm. With appropriate times for sputtering, PCS thin films were deposited on the AZ31 substrate with thicknesses (t) of 30, 50, 100, 200, 300, 500, 1000 or 2000 nm. These specimens are denoted as PCS-30, PCS-50, PCS-100, PCS-200, PCS-300, PCS-500, PCS-1000, and PCS-2000, respectively.
The film structure was characterized by Bede D1 HR-XRD grazing incidence in-plane X-ray diffracttion (XRD), and the film compositions were confirmed by JEOL-6400 scanning electron microscopy (SEM) linked with energy dispersive X-ray spectrometry (EDS). Microhardness measurements were conducted via a Shimadzu Vicker’s Microhardness Tester with various loads from 10 to 100 g for a fixed duration of 10 s. For comparisons of hardness measured using different testing instruments, all coating samples were also measured by an MTS XP nanoindenter system with a Berkovich indent tip, using the continuous stiffness measurement (CSM) mode. In the analysis of the nanoindentation test, the indented depth was set from the shallow up to the deeper regime (double the film thickness) to obtain the average hardness contributed by the Pd-Cu-Si thin film and the AZ31 substrate. After microhardness and nanoindentation testing, a JEOL-6700 Field-Emission SEM was used to observe the surface condition and morphology of indentation marks.
3. Results and discussion
The Pd-Cu-Si thin films deposited on the AZ31 Mg alloy were firstly identified by XRD and SEM/EDS. According to the EDS results, the composition of the Pd-Cu-Si thin films was close to PCS. The XRD patterns showed a broad diffraction hump characteristic of an amorphous nature. Fig. 1 presents the XRD pattern of the 2000 nm Pd77Cu6Si17 TFMG coat on the AZ31 substrate. The PCS amorphous hump is located within the 2θ diffraction angle range of 35° to 50°.
Fig.1 XRD pattern of the PCS amorphous thin film (2000 nm) deposited on the AZ31 substrate (of a hexagonal close-packed structure)
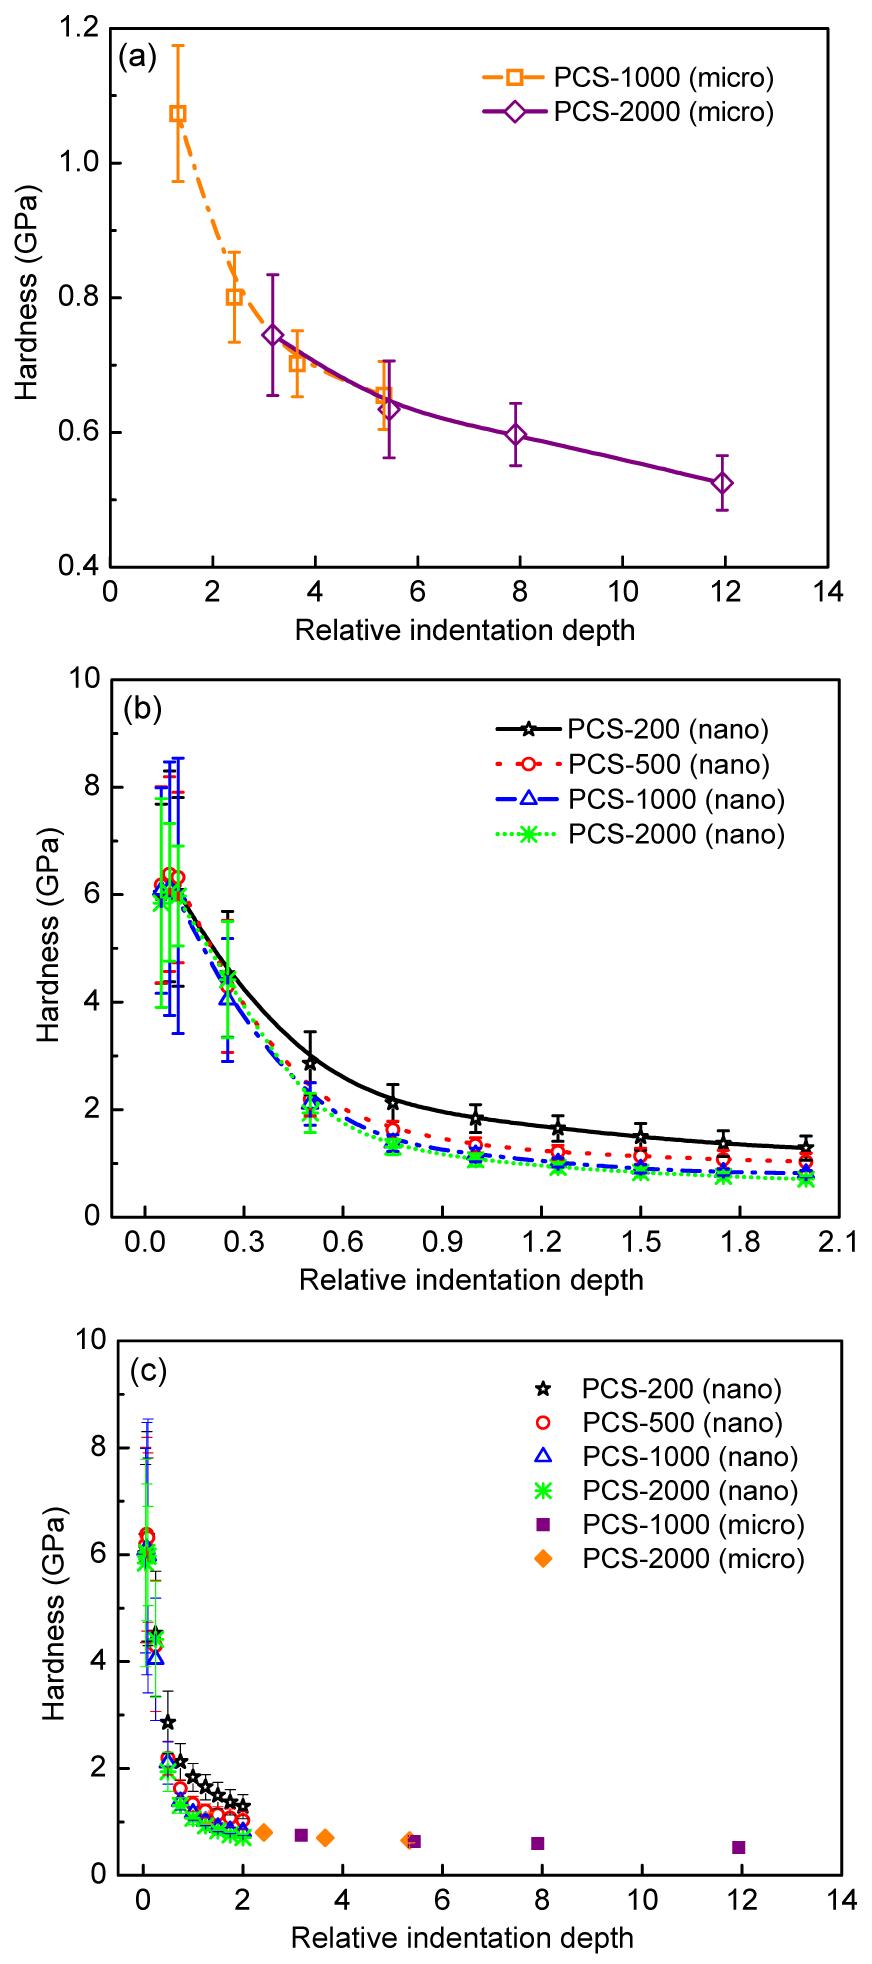
Shimadzu Vicker’s microhardness measurement provided a simple way to test whether the TFMGs hardened the AZ31 Mg surfaces. As the starting point for comparison, the Shimadzu Vicker’s hardness of the AZ31 substrate (without coating) after mechanical grinding and polishing was measured. The average value was 53 HV, which can be transformed into 0.52 GPa. The penetration depth of indentation (d) over the film thickness (t), namely, d/t, is denoted as β. For the microhardness test, the ratio was more than 1 for all cases, ranging from 1.25 up to 11. The β value, applied load (f), and measured hardness (H) of PCS-1000 and PCS-2000 specimens resulting from microhardness tests are listed in Table 1. The hardness measurements and percentages of enhancement from microhardness and nanoindentation tests are shown in Fig. 2.
Table 1
Hardness of the PCS TFMGs deposited on the AZ31 substrate, obtained from the microhardness tests
Thickness (nm)
β
f (mN)
H (GPa)
1000
3
98
0.74±0.02
5
245
0.65±0.03
8
490
0.60±0.01
11
980
0.53±0.01
2000
1.25
98
1.07±0.05
2.5
245
0.79±0.02
3.5
490
0.71±0.02
5
980
0.66±0.03
Fig.2 Hardness-β curves of the PCS-1000 and PCS-2000, measured from microhardness tests (a), and the PCS-200, PCS-500, PS-1000, and PCS-2000, measured by nanoindentation tests (b). The combined hardness-β plots for all the experimental data measured from the micro-hardness and nanoindentation tests are presented in (c)
When the penetration depth was limited to the shallow region, the apparent hardness of the AZ31 substrate surface could be enhanced to more than 100%. These results can be attributed to the protection afforded by the hard TFMG. Then, the hardness decreased with increasing β ratio. When 1<β<2, the hardness dropped rapidly because of the rising contribution of the AZ31 substrate. The enhancement of TFMG to the whole material declined. When β>2, the hardness of the AZ31 substrate started to dominate the whole system. Thus, the tendency of hardness to decrease slowed down in the range of 2<β<11, gradually approaching the hardness of the AZ31 substrate. The two microhardness-β curves for PCS-1000 and PCS-2000 match well (Fig. 2a). The current results demonstrate that thicker films exhibit higher hardness under the same load. This is reasonable because the thicker films require a larger load to achieve the same indentation depth due to the hard nature of TFMG. Nevertheless, in this case, the relationship of the film thickness to the hardness can be attributed to the effect of the thickness of the TFMGs on the β ratio. Table 1 shows that the β ratio is almost inversely related to the film thickness under the same load. Thus, in this study, we discuss only the function of the β ratio in determining the system hardness.
For nanoindentation, the indented β ratio was limited to within 2 (Fig. 2b). Due to the dominant role of TFMG, the nanoindentation hardness readings were mostly higher than 2 GPa, significantly higher than that of the AZ31 substrate (0.52 GPa). Though the indentation tips for the microhardness and nanoindentation were not the same, the trends of the hardness-β curves obtained from these two tests were combined for comparison (Fig. 2c). It is evident that the basic trend in the variation in hardness as a function of the β ratio was similar from the nano to the micron range.
Here, we use the PCS-2000 as an example to demonstrate the indented surface morphology. Figs. 3a and 3b show representative SEM images of the PCS-2000 coated specimen at the applied loads of 10g (or 98 mN) and 100g (980 mN), respectively, under microhardness testing. Compared to the AZ31 substrate, the surface of PCS-2000 was always much smoother. The β ratio of PCS-2000 loaded at 10g (98 mN) was about 1.25. Based on the inclined sides of the microhardness marks in Fig. 3a, even though the indentation depth was larger than the film thickness, no obvious crack could be seen around the mark. Instead, a small number of shear bands were found at the edge of the mark. The TFMG coating may provide fracture resistance during indentation deformation.
Fig.3 SEM micrographs of PCS-2000 under microhardness loading, at 98 mN and β=1.25 (a) and 980 mN and β=5 (b). The indented morphology of the same PCS-2000 under nanoindentation loading at 257 mN and β=2 is presented in (c)
As the load and β ratio increased to 50g (490 mN) and 3.5 (not shown), respectively, shear bands could be observed more easily around the marks. Shear bands originating beneath the indentation mark can propagate outwards to the free surface, so as to release the applied stress and maintain plasticity to prevent the films from cracking. With a further increase to 100g (980 mN) and 5, the shear bands became closely-spaced and more obvious (Fig. 3b). Moreover, some small impurities could also be observed on the surface of specimens (Fig. 3b). As confirmed by SEM/EDS, these impurities were oxides resulting from the deposition processes. During microhardness/nanoindentation testing, stress concentration near these impurities could occur. When the concentrated stress exceeds a critical value for the PCS TFMGs, cracks would be induced.
Fig. 3c shows an SEM image of PCS-2000 at β=2 under the most severe nanoindentation testing. The indentation depth reaches 4 μm and β reaches 2, comparable to microhardness testing. The shear bands in the PCS TFMG under Berkovich indentation still play the role of releasing stress and moderating deformation. Furthermore, without the large impurities on the surface here, there is no striking crack near the mark. Clearly, the surface conditions of the substrate and the coated film affect the indentation performance. Based on the above observations, the evolution of the indentation and shear banding morphology for various PCS coating thicknesses appears to be basically similar in the various samples. The hardness-β curves from microhardness and nanoindentation tests showed similar trends (Fig. 2). This postulation is supported by the observation that the β ratio is the main controlling factor.
Various ceramic or metallic hard thin coatings have been applied for preventing damage and improving the hardness properties of substrate (Navinsek et al., 1998; Tuck et al., 2001; Ahn and Kwon, 2000). For analyzing the enhancement of hardness, the interaction between the hard thin coating and the soft substrate needs to be clarified under different conditions. A work-of-indentation approach was extended to a general formula by Tuck et al. (2001). The hardness of each constituent and coating thickness can be integrated and expressed by ,
where Hs is the relative minimal hardness of the substrate with the hard coating thin film at β=10, Hf is the intrinsic hardness of the coated film, k is a dimensionless hardness transition parameter, and X is the power exponent depending on the deformation mode and geometry. With the above measured system hardness H, the relative substrate and film hardness can be extracted based on Eq. (1). Note that if the substrate hardness value Hs were fixed in the fitting process, the measured hardness reading H would depend seriously on the intrinsic hardness of the coated film Hf. In such a case, the critical function of the bonding characteristics of the coated film and substrate on the measured hardness reading H is ignored.
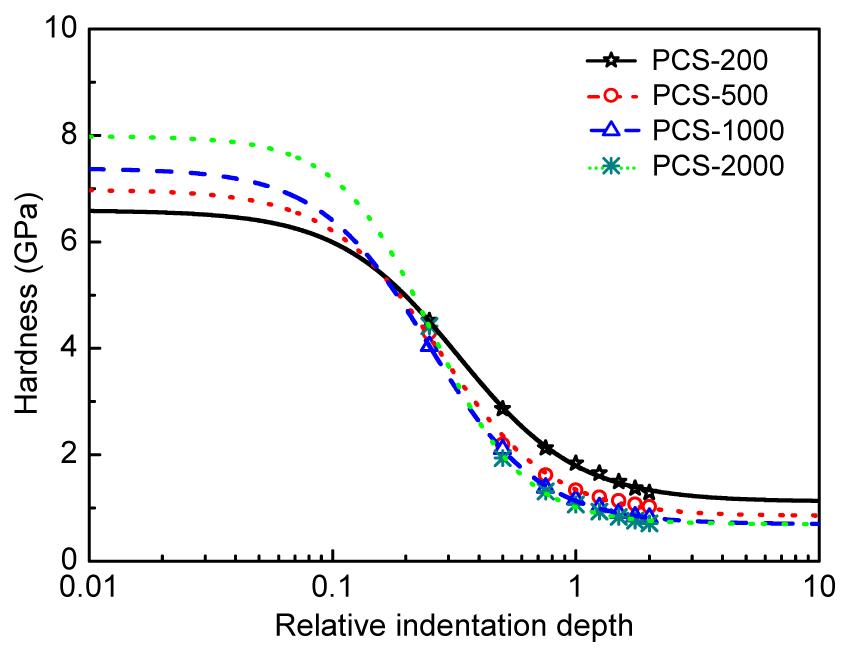
Since more than one variable is involved, we need to use an iterative extrapolation method to calculate the best fit values of Hs and Hf, etc. The details of all fitting results for various samples are presented in Table 2. Fig. 4 shows that the combined data from the least square curve fits with the empirical data on the PCS coatings of 200, 500, 1000, and 2000 nm thickness, respectively, with a correlation coefficient R2 of over 0.997 between the model and the experimental data. Thus, the model fits well with the experimental data. Note that the experimental data used to fit the lines in Fig. 4 exclude those data obtained in the very shallow regime with β less than 0.1. This is because these data show greater scattering. If only the average hardness readings are used, the fitting is still good. The fittings indicate that the Hs values for AZ31 substrate are located between 0.69 and 1.20 GPa, Hf values between 6.59 and 7.98 GPa, k values between 7.08 and 22.03, and X values between 1.76 and 2.26.
Table 2
Fitting parameters of PCS TFMGs deposited on AZ31 substrate obtained from nanoindentation data
t (nm)
Hs (GPa)
Hf (GPa)
k
X
30
0.97±0.10
4.92±0.55
3.34
1.35
50
1.11±0.07
5.53±0.39
5.85
1.52
100
1.14±0.01
5.92±0.21
6.58
1.72
200
1.20±0.05
6.59±0.14
7.08
1.76
300
0.97±0.03
6.72±0.17
10.72
1.85
500
0.85±0.04
6.98±0.18
11.34
1.90
1000
0.70±0.02
7.38±0.26
14.36
1.92
2000
0.69±0.04
7.98±0.31
22.03
2.26
Fig.4 Comparison of the experimental data (in various symbols) and the best fit predictions based on Eq. (1) (in various lines) for PCS-200, 500, 1000 and 2000 samples under nanoindentation. Note that the horizontal axis is presented in log scale
Hardness values are expected to increase as the thickness of similar coatings increases, and hence the coating plays a more important role in energy absorption during indentation (Korsunsky et al., 1998; Tuck et al., 2001).
For the current experiment, the coatings of different thickness had similar microstructures, due to the same deposition conditions. Therefore, the variation in X, k, Hs, Hf, and H can be discussed as follows. The X value represents a hardness shifting factor between the substrate and the coating film with the different deformation modes, geometry, and their interactions. When the thin film and the substrate can deform together at the same time (as the case of the 200 nm coating), the external pressures from indentation can be evenly distributed over the film and substrate, resulting in a smaller X value and a smoother hardness-β curve (Fig. 4). However, when the coating is over the critical thickness (as in the case of the 2000 nm coating), the coated film would become an independent hard material with weaker interaction with the substrate as a separate bulk. Under applied pressure or load, the film takes most of the deformation energy by itself as a victim material. The resulting X value will be higher and the hardness-curve will be steeper (Fig. 4). When a fatal force cannot be absorbed by the coated hard thin film, the film will be damaged or will collapse, and the substrate will be exposed.
The above arguments may also be applied to the fitting parameter k value. The k value is a dimensionless hardness transition parameter that will affect the second term in Eq. (1), namely, ΔH/(1+kβX), where ΔH represents (Hf−Hs). When k is small (as when k=7.08 for the thinner PCS-200 sample), the second term will be larger, leading to a higher measured apparent hardness H, and vice versa. The k value will also affect the relative contribution of the load carrying by the substrate and film. Based on the calculation of Tuck et al. (2001), the hardness-β curves under a given X will shift to the right with increasing k value. This means that the film will carry a higher percentage of indented load, and the high to low hardness transition (or the deflection point in Fig. 4) will sustain until a higher β ratio. However, this trend is not so obvious in Fig. 4 since the X value is not fixed.
For the factors of Hs and Hf listed in Table 2, the interaction between substrate and film becomes weaker with increasing film thickness. Therefore, the relative minimal substrate hardness Hs gradually decreases from 1.1 to 0.69 GPa, and approaches the hardness of the original AZ31 substrate (=0.52 GPa) without a coating. Note that the extracted Hs does not appear to be a fixed value (=0.52 GPa) from the iterative extrapolation method. This is a result mainly of the mutual interaction between the coated film and the substrate, partly due to the residual stress retained in the soft AZ31 substrate and partly to the constraint from the film. At the same time, with increasing film thickness, the film hardness gradually increases from 6.59 to 7.98 GPa, and approaches the ideal PCS film material hardness (around 8 to 10 GPa). This result is consistent with the previous finding (Tuck et al., 2001) that the intrinsic coated film hardness (Hf) increases with increasing thickness of the coated film.
From the experimentally measured apparent hardness H, and the extracted film hardness Hf, the 2000 nm sample always exhibited much higher readings. This might suggest that the 2000 nm film coating would yield the best surface hardening effect for the AZ31 Mg alloy. Nevertheless, the higher k and X values of this sample reveal a weaker interaction between the substrate and film. Thus, the thicker film will carry most of the load and become prone to cracking. For solid bonding and better plasticity of the coated film, a lower X and a more even distribution of the applied load on both substrate and film would be a more promising selection. With this consideration, the 200 nm coatings appear to be more feasible.
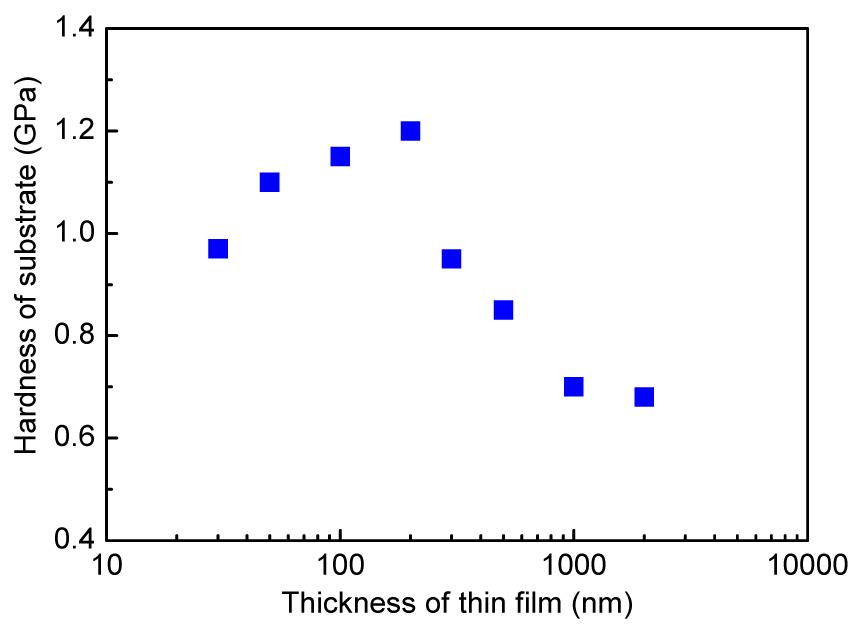
It is interesting to identify the range for the optimum thickness of PCS coated film. In this study, PCS TFMG films thinner than 100 nm or less would lead to unsatisfactory film coverage. The ultra thin film would often give inadequate surface hardness. The optimum extracted substrate relative hardness Hs was found to be around 200 nm, as demonstrated by the predicted trend of Hs as a function of the surface hard coating thickness in Fig. 5.
Fig.5 Predicted and postulated trend of the relative minimal substrate hardness Hs as a function of the surface hard coating thickness. The optimum hard coating thickness might be around 200 nm
Finally, from a practical tribological view, the thickness of a hard coating layer on softer substrate usually needs to be of the order of tens of microns or more. The very thin hard layer of 200 nm might be subjected to scratch or plastic deformation damage. Our parallel studies (Liu et al., 2009; 2010; Kuan et al., 2010; Chou et al., 2011; Pei et al., 2011) suggest that a multilayered composite coating, with alternative metallic glass and pure metal layers, would be much more promising than one thin layer of monolithic metallic glass. Each individual metallic glass and pure metal layer thickness would still be around 200 nm, but the overall multilayered composite coating could be on a scale of several micrometers.
4. Conclusions
In this study, PCS TFMG is demonstrated to be a promising protective film to enhance the hardness of AZ31 Mg alloy. With a proper PCS coating, the apparent measured surface hardness, and probably the surface wear resistance, can be substantially enhanced. The evolution of shear bands in the TFMG coated layer provides a moderate deformation mode in preventing the film from cracking severely. Based on the SEM images with local micro-cracks, we deduce that particles retained in AZ31 Mg would cause local cracking when the indented load reaches a critical level.
Consistent with the equation derived by Tuck et al. (2001), the relative indentation depth (β) appears to be the key parameter affecting the overall deformation mode and substrate-film interaction. Through the iterative calculations of computer software, the involved parameters X, k, Hs, and Hf are extracted accordingly. As Hf increases from 6.59 to 7.98 GPa with increasing film thickness, the interaction between the AZ31 substrate and PCS TFMG film becomes weaker, resulting in the extracted relative substrate hardness Hs decreasing from 1.20 to 0.69 GPa. For thinner TFMG coatings, the coated film and the substrate have the lowest X and a smaller relative hardness gap, and the applied load is easier to distribute evenly over the film and substrate. This will lead to a smoother hardness-β curve and a lower tendency of coating cracking. In this respect, coatings of 200 nm appear to be more feasible. Judging from all factors related to hardness/wear improvement, load transfer distribution, and film cracking issues, the optimum coating thickness in this study was around 200 nm.
[1] Ahn, J.H., Kwon, D., 2000. Micromechanical estimation of composite hardness using nanoindentation technique for thin-film coated system. Materials Science and Engineering: A, 285(1-2):172-179.
[2] Chou, H.S., Du, X.H., Lee, C.J., Huang, J.C., 2011. Enhanced mechanical properties of multilayered micropillars of amorphous ZrCuTi and nanocrystalline Ta layers. Intermetallics, 19(7):1047-1051.
[3] Chu, J.P., Liu, C.T., Mahalingam, T., Wang, S.F., OKeefe, M.J., Johnson, B., Kuo, C.H., 2004. Annealing-induced full amorphization in a multicomponent metallic film. Physical Review B: Condensed Matter and Materials Physics, 69(11):113410
[4] Ferkel, H., Mordike, B.L., 2001. Magnesium strengthened by SiC nanoparticles. Materials Science and Engineering: A, 298(1-2):193-199.
[5] Gray, J.E., Luan, B., 2002. Protective coatings on magnesium and its alloys—a critical review. Journal of Alloys and Compounds, 336(1-2):88-113.
[6] Hata, S., Sato, K., Shimokohbe, A., 1999. Fabrication of Thin Film Metallic Glass and Its Application to Microactuators. , Proc. SPIE 3892, Device and Process Technologies for MEMS and Microelectronics, Gold Coast, Australia, :
[7] Hata, S., Liu, Y.D., Wada, K., Shimokohbe, A., 2001. Fabrication of thin film metallic glasses and their properties. Journal of the Japan Society for Precision Engineering, (in Japanese),67(10):1708-1713.
[8] Inoue, A., 2000. Stabilization of metallic supercooled liquid and bulk amorphous alloys. Acta Materialia, 48(1):279-306.
[9] Inoue, A., Kato, A., Zhang, T., Kim, S.G., Masumoto, T., 1991. Mg-Cu-Y amorphous alloys with high mechanical strengths produced by a metallic mold casting method. Materials Transactions, JIM, 32(7):609-616.
[10] Inoue, A., Shen, B.L., Koshiba, H., Kato, H., Yavari, A.R., 2003. Cobalt-based bulk glassy alloy with ultrahigh strength and soft magnetic properties. Nature Materials, 2(10):661-663.
[11] Johnson, W.L., 1998. Bulk Glass-forming Metallic Alloys: Science and Technology [1998 Mrs Medal Award Lecture, Presented at Symposium Mm]. MRS Proceedings, 554, 311,:
[12] Kojima, Y., 2000. Platform science and technology for advanced magnesium alloys. Materials Science Forum, 350-351(3):3-18.
[13] Korsunsky, A.M., McGurk, M.R., Bull, S.J., Page, T.F., 1998. On the hardness of coated systems. Surface and Coatings Technology, 99(1-2):171-183.
[14] Kuan, S.Y., Chou, H.S., Liu, M.C., Du, X.H., Huang, J.C., 2010. Micromechanical response for the amorphous/amorphous nanolaminates. Intermetallics, 18(12):2453-2457.
[15] Liu, M.C., Huang, J.C., Chou, H.S., Lai, Y.H., Lee, C.J., Nieh, T.G., 2009. A nanoscaled underlayer confinement approach for achieving extraordinarily plastic amorphous thin film. Scripta Materialia, 61(8):840-843.
[17] Navinsek, B., Panjan, P., Kruič, J., 1998. Hard coatings on soft metallic substrates. Surface and Coatings Technology, 98(1-3):809-815.
[18] Pang, S.J., Zhang, T., Asami, K., Inoue, A., 2001. New Fe-Cr-Mo-(Nb, Ta)-C-B glassy alloys with high glass-forming ability and good corrosion resistance. Materials Transactions, JIM, 42(2):376-379.
[19] Pei, H.J., Lee, C.J., Du, X.H., Chang, Y.C., Huang, J.C., 2011. Tension behavior of metallic glass coating on Cu foil. Materials Science and Engineering: A, 528(24):7317-7322.
[20] Tuck, J.R., Korsunsky, A.M., Bhat, D.G., Bull, S.J., 2001. Indentation hardness evaluation of cathodic are deposited thin hard coatings. Surface and Coatings Technology, 139(1):63-74.


Open peer comments: Debate/Discuss/Question/Opinion
<1>