Yue-ping Xu, Chong Ma, Su-li Pan, Qian Zhu, Qi-hua Ran. Evaluation of a multi-site weather generator in simulating precipitation in the Qiantang River Basin, East China[J]. Journal of Zhejiang University Science A, 2014, 15(3): 219-230.
@article{title="Evaluation of a multi-site weather generator in simulating precipitation in the Qiantang River Basin, East China", author="Yue-ping Xu, Chong Ma, Su-li Pan, Qian Zhu, Qi-hua Ran", journal="Journal of Zhejiang University Science A", volume="15", number="3", pages="219-230", year="2014", publisher="Zhejiang University Press & Springer", doi="10.1631/jzus.A1300267" }
%0 Journal Article %T Evaluation of a multi-site weather generator in simulating precipitation in the Qiantang River Basin, East China %A Yue-ping Xu %A Chong Ma %A Su-li Pan %A Qian Zhu %A Qi-hua Ran %J Journal of Zhejiang University SCIENCE A %V 15 %N 3 %P 219-230 %@ 1673-565X %D 2014 %I Zhejiang University Press & Springer %DOI 10.1631/jzus.A1300267
TY - JOUR T1 - Evaluation of a multi-site weather generator in simulating precipitation in the Qiantang River Basin, East China A1 - Yue-ping Xu A1 - Chong Ma A1 - Su-li Pan A1 - Qian Zhu A1 - Qi-hua Ran J0 - Journal of Zhejiang University Science A VL - 15 IS - 3 SP - 219 EP - 230 %@ 1673-565X Y1 - 2014 PB - Zhejiang University Press & Springer ER - DOI - 10.1631/jzus.A1300267
Abstract: Recent years have seen a surge in assessment of potential impacts of climate change. As one of the most important tools for generating synthetic hydrological model inputs, weather generators have played an important role in climate change impact analysis of water management. However, most weather generators like statistical downscaling model (SDSM) and long Ashton research station weather generator (LARS-WG) are designed for single site data generation. Considering the significance of spatial correlations of hydro-meteorological data, multi-site weather data generation becomes a necessity. In this study we aim to evaluate the performance of a new multi-site stochastic model, geo-spatial temporal weather generator (GiST), in simulating precipitation in the qiantang River Basin, East China. The correlation matrix, precipitation amount and occurrence of observed and GiST-generated data are first compared for the evaluation process. Then we use the GiST model combined with the change factor method (CFM) to investigate future changes of precipitation (2071–2100) in the study area using one global climate model, Hadgem2_ES, and an extreme emission scenario RCP 8.5. The final results show that the simulated precipitation amount and occurrence by GiST matched their historical counterparts reasonably. The correlation coefficients between simulated and historical precipitations show good consistence as well. Compared with the baseline period (1961–1990), precipitation in the future time period (2071–2100) at high elevation stations will probably increase while at other stations decreases will occur. This study implies potential application of the GiST stochastic model in investigating the impact of climate change on hydrology and water resources.
Darkslateblue:Affiliate; Royal Blue:Author; Turquoise:Article
Article Content
1. Introduction
Global warming caused by increasing greenhouse gas emissions has become evident. Global average surface temperature increased 0.74 °C during the period of 100 years from 1906 to 2005 and global average precipitation increased 2% within the same period (Ju et al., 2013). Because of its heavy dependence on agriculture, rapid development of its economy, and urbanization, China is very sensitive to climate change. As a result, assessment of the impact of climate change will play an important role in making robust decisions. Many researchers have worked on investigating the impact of climate change on hydrology or water resources in China (Zhai et al., 2005; Wang et al., 2012; Xu et al., 2013).
General circulation models (GCMs) are common tools for projecting future climate chang, but there are scale gaps between the outputs of GCMs and basin-scale meteorological data. Much work has therefore been done to develop various downscaling approaches (Wilby and Wigley, 1997; Fowler et al., 2007; Salvi et al., 2013). Dynamic downscaling and statistical downscaling are two main approaches for downscaling GCMs outputs to basin or site scale data. Dynamic downscaling preserves spatial correlation as well as physically plausible relationships between variables, but it is often computationally intensive (Xu et al., 2012). Statistical downscaling approaches, including regression-based methods (Schoof and Pryor, 2001), weather classification methods (Khan et al., 2006), and stochastic weather generators (Semenov and Barrow, 1997), have been developed to simulate quantitative relationships between large-scale atmospheric variables and local surface variables. Weather generators, one of the statistical downscaling approaches, can create synthetic daily weather data for a long period of time and are important tools for creating synthetic inputs for hydrological models.
Nowadays, weather generators play an important role in analysis of the impact of climate change (Semenov and Barrow, 1997; Kilsby et al., 2007). There are some well-known weather generators like long Ashton research station weather generator (LARS-WG) (Racsko et al., 1991), climate generator (CLIGEN) (Nicks and Gander, 1994), and statistical downscaling model (SDSM) (Wilby and Dawson, 2013). They all have advantages, but are single-site based. When hydrological models need multi-site inputs, or spatial correlation is important for hydrologic simulation, a multi-site weather generator is a necessity. Several multi-site weather simulation methods have been developed. Wilks (1998) was the first to present a method that reproduced the main statistics of multi-site precipitation data. Wilks (1998)’s approach drives the stochastic weather generator with serially independent and spatially correlated random numbers. The correlation matrices of both precipitation occurrence and amounts are used in this method to generate precipitation data (Brissette et al., 2007). The main defect of this method is that the correlations of simulated synthetic data are often weaker than the observed counterpart. A multi-site hidden Markov Chain model is one of the leading methods for generating synthetic precipitation data with spatial correlations. The climate is divided into two states in this model (wet or dry) and the persistence of a state is decided by transition probability (Thyer and Kuczera, 2003). The multi-site precipitation occurrence is decided by the weather state and the precipitation amount is based on both exogenous predictors and weather states. However, this model has a quite complicated process to calibrate the parameter and it is hard to evaluate its accuracy. Alternatively the spatial moving average process approach (Khalili et al., 2007), the K-nearest-neighbor (Mehrotra et al., 2006) approach, and the Schaake Shuffle approach (Clark et al., 2004) are often used in weather generation. All of the above methods have their own advantages and disadvantages. Their processes are normally very complex and hard to implement.
In this paper, a relatively new method, geo-spatial temporal weather generator (GiST) stochastic model is used to generate synthetic weather data and its performance is evaluated in the Qiantang River Basin, East China. The GiST model was developed by Baigorria and Jones (2010). It can not only reproduce synthetic precipitation data with appropriate temporal and spatial structure of observed precipitation but also is easy to implement. The GiST model is then combined with the change factor method (CFM) to downscale precipitation from one GCM model, Hadgem2_ES, and one emission scenario, RCP 8.5, to demonstrate the usefulness of the GiST model.
2. Data and methods
2.1. Study area
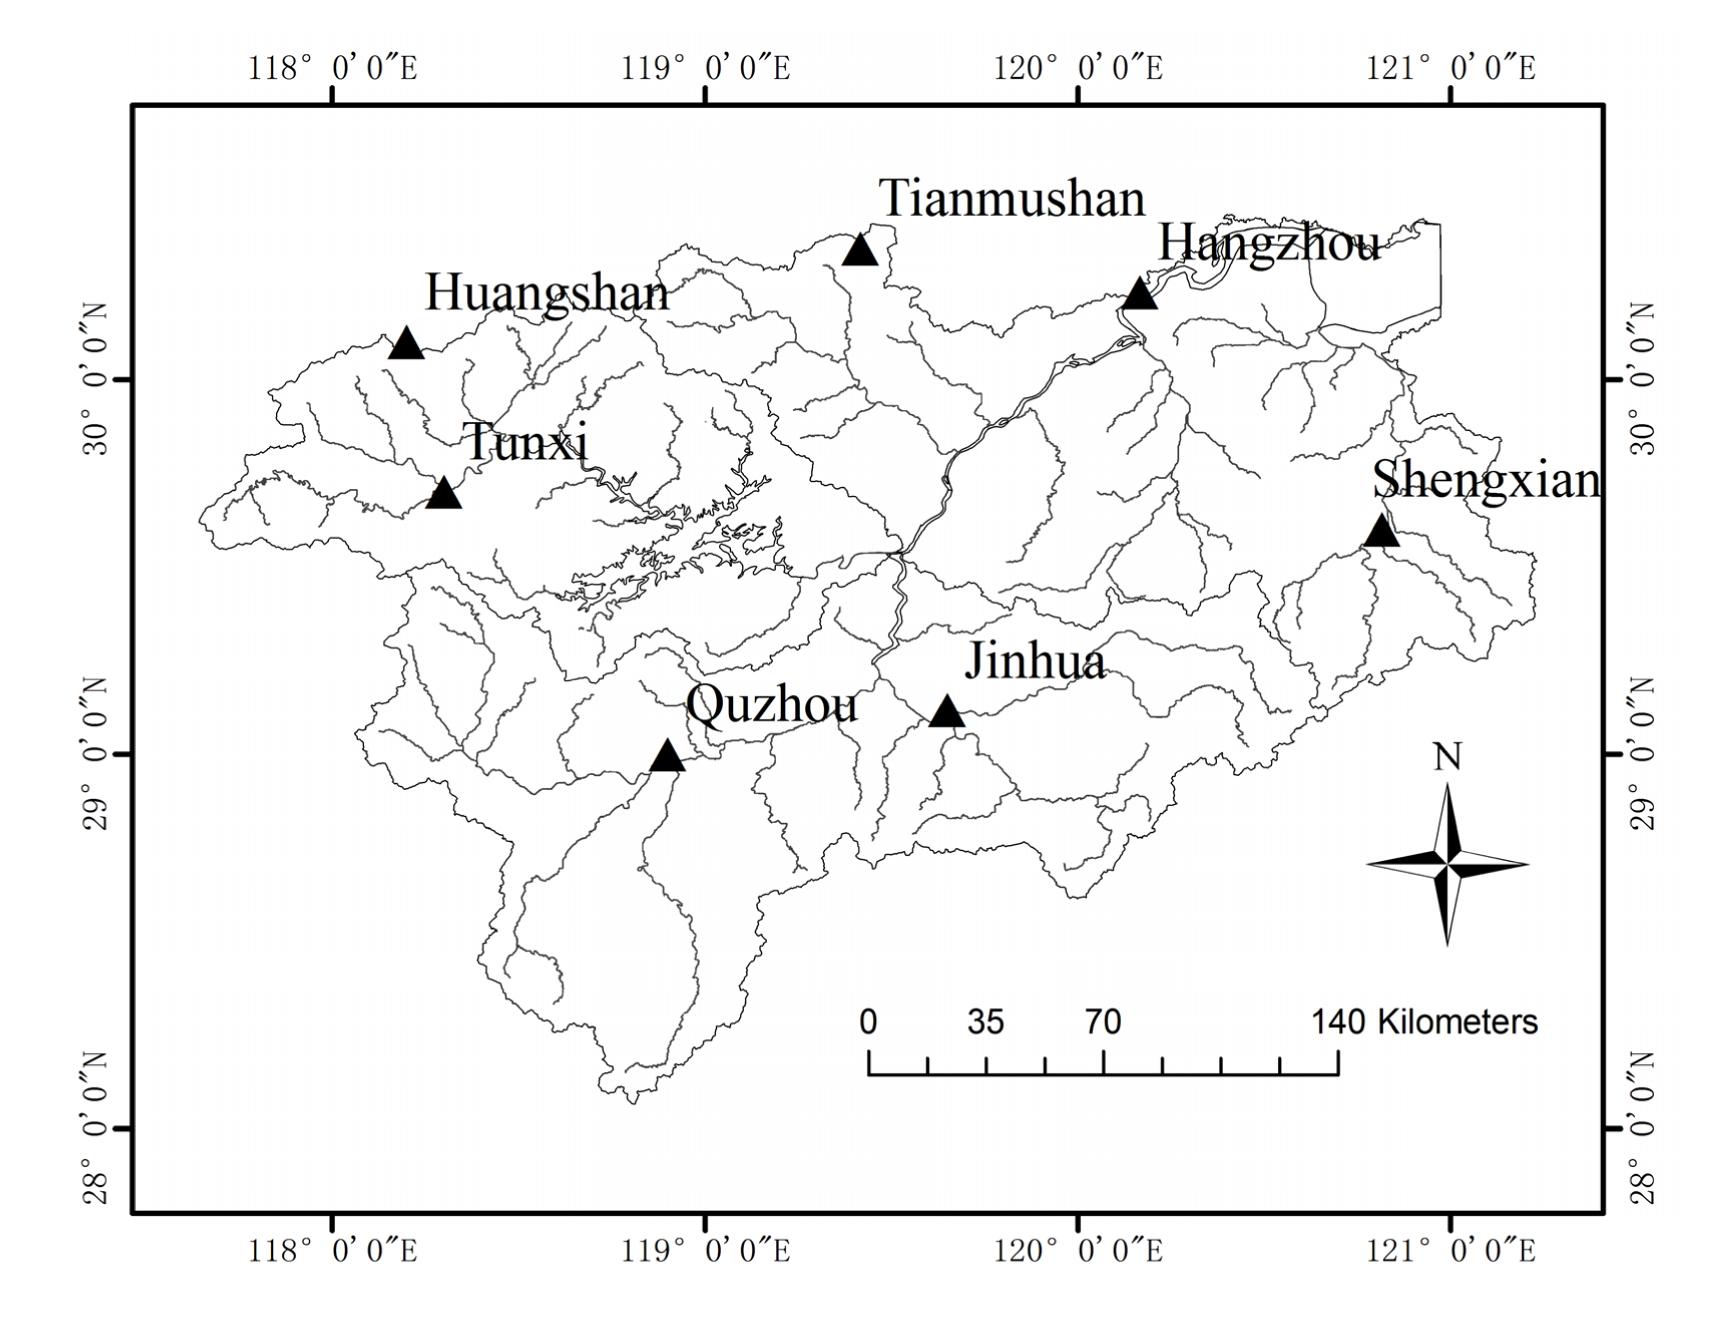
The Qiantang River Basin, located in the east of China, covers an area of 55 600 km2, including 48 000 km2 in Zhejiang Province. The catchment lies between longitudes 117°E and 122°E and latitudes 28°N and 31°N. The main stream, the Qiantang River, with a length of 688 km, is the longest river in Zhejiang Province. The river runs out of Xiuning in Anhui Province and empties into the Donghai Sea through Hangzhou Bay. Most of the basin is dominated by a sub-tropical humid monsoon climate. The mean annual precipitation in the Qiangtang River Basin is close to 1600 mm, and the mean annual temperature is 17 °C (Xu et al., 2012). Fig. 1 shows the location of the study area and the meteorological stations of the sub-basins. Table 1 shows details of relevant meteorological stations.
Fig.1 Location of the study area and meteorological stations used in the study
Table 1
Information on the stations in the Qiantang River Basin from 1961 to 1990
Station
Longitude (°E)
Latitude (°N)
Hangzhou
120°10′
30°14′
Huangshan
118°09′
30°08′
Jinhua
119°39′
29°07′
Quzhou
118°54′
29°00′
Shengxian
120°49′
29°36′
Tianmushan
119°25′
30°21′
Tunxi
118°17′
29°43′
2.2. Multi-site weather generator and change factor method (CFM)
2.2.1. Multi-site weather generator
GiST, a stochastic model developed by Baigorria and Jones (2010), is used to generate spatially and temporally correlated daily weather data in this study. The main difference between GiST and other traditional weather generators is that the spatial structure of the weather data is considered. The spatial structure is represented by Pearson’s correlation (ρij) which is calculated by
,
where η represents the total number of pair-wise daily observations, χi and χj represent the pair-wise observations on day t for locations i and j, μi and μj represent the mean of daily values for locations i and j, respectively, and σi and σj represent the standard deviations of daily observations.
Two steps are included to generate precipitation occurrences in the GiST model. The first step is to calculate parameters and initial conditions, including Pearson’s correlation matrix, the Euclidean N-correlation distance, two-state orthogonal Markov transitional probabilities, and the spatially correlated total number of monthly precipitation occurrences at each location. The second step is to generate the spatially and temporally correlated precipitation occurrences, including resampling, iteratively ordering the total block of daily generated values in a month for the two most associated locations and using the two-state orthogonal Markov transitional probabilities to generate precipitation occurrences for the other locations (Baigorria and Jones, 2010).
The generation of precipitation amounts is calculated at the point where precipitation occurs. The equation for generation of precipitation amounts is given as follows (Baigorria and Jones, 2010):
,
where indicates a vector of spatially correlated random numbers following a Gamma distribution, and α and β are shape and scale parameters of the gamma function (Г).
2.2.2. Change factor method (CFM)
The CFM, or delta change factor method, is combined with GiST to obtain climate change projections in the future period 2071–2100 and to evaluate the future performance of GiST. CFM is a very common method for estimating climate change (Anandhi et al., 2011). Although more complicated methods exist, CFM is still widely applied in many studies.
In most conditions, CFMs are categorized by a temporal scale, mathematical formulation, and number of change factors. For a temporal scale, it means that the method can be classified by time scales, e.g., daily, monthly, seasonally, and yearly. Higher frequency usually gives results of lower reliability. In this study, the monthly scale is adopted. There are two forms of mathematical formulations of CFM, additive and multiplicative. Different mathematical formulations are used for different variables. For example, additive change factor (CF) is often used for temperature and multiplicative CF is often used for precipitation (Anandhi et al., 2011). Multiplicative is also used for standard deviation of temperature.
In this study, the following equation is used to calculate the CFs of precipitation:
,
where and represent the mean values of GCM outputs from the baseline and for future periods, respectively, which can be calculated by
,
,
where Nb and Nf are the numbers of values during the baseline period and the future period, respectively.
To obtain climate change projections for the future period 2071–2100, the parameters of the GiST are then adjusted using CFs calculated by Eq. (3). Details of adjustments can be found in (Qian et al., 2005).
2.3. Future climate change scenario and GCM
The newest representative concentration pathways (RCPs) emission scenarios are used in this study. Each RCP is named after the level of radiative forcing, or overall warming power of human activities, expected in 2100. Table 2 shows the details of four RCPs.
Table 2
Information of four RCPs
RCP
Radiative force in 2100 (W/m2)
CO2 concentration in 2100
RCP 2.6
3.0
490×10−6
RCP 4.5
4.5
650×10−6
RCP 6.0
6.0
850×10−6
RCP 8.5
8.5
1370×10−6
Future climate data come from one of the coupled model intercomparison project phase 5 (CMIP5) models, Hadgem2-ES. Hadgem2-ES is short for the Hadley Centre Global Environmental Model, version 2, with an added Earth-system component. It represents more physical elements of the climate than air, sunlight, and water. Hadgem2-ES has a grid of 192 evenly spaced points from east to west and 144 evenly spaced points from north to south. A box defined by about 1° of latitude and 1° of longitude represents an area of 100 km by 200 km. The atmosphere is divided into 38 unequal levels and the level near the land and ocean surface is about 20 m deep (Jones et al., 2011).
For evaluation purposes, one extreme emission scenario RCP 8.5 is used in this study for illustration. The RCP 8.5 scenario describes a future world of the largest population, a low technology innovation rate, slow energy development, more emissions, and absence of a policy of adaptation to climate change. Its radiative forcing can be found in Table 2.
3. Results
3.1. Evaluation results of multi-site weather generator
To evaluate the performance of the GiST model in the Qiantang River Basin, Pearson’s correlations, the precipitation amount and the occurrence of observed and GiST-generated data are computed. Pearson’s correlation is introduced in this study to represent the spatial correlations among multi-site in the Basin. Fig. 2 shows Pearson’s correlations of observed and generated daily and monthly precipitation (1961–1990) among all pairs of locations in the baseline period (1961–1990). The solid line is the 45° line. Fig. 2a shows that for daily precipitation, the correlations are underestimated. For monthly precipitation (Fig. 2b), for most stations, Pearson’s correlations of generated data are close to those of the observed data. This underlines the fact that GiST reproduces the spatial correlations for the given region well on a monthly scale. On a daily scale, although underestimated, the correlations are still reasonably simulated.
Fig.2 Pearson’s correlations of daily precipitation (a) and monthly precipitation (b) in the baseline period (1961–1990)
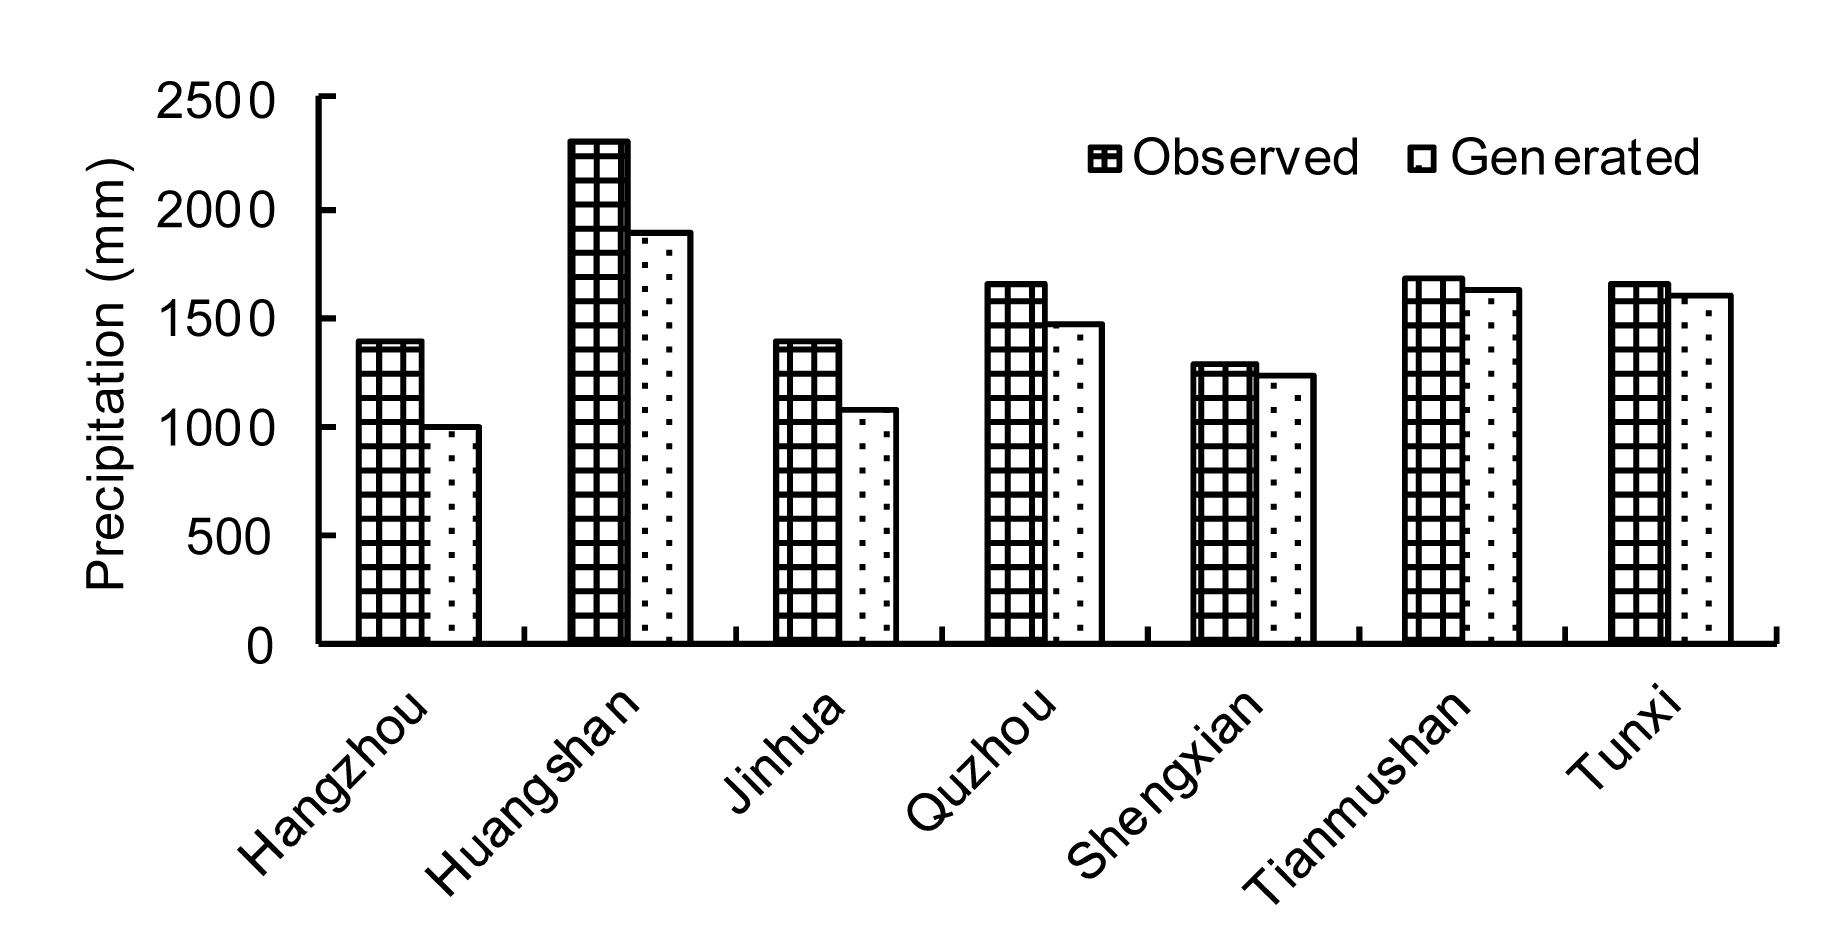
Fig. 3 shows the observed and generated annual precipitation amounts in the baseline period. From Fig. 3, it can be concluded that at Shengxian, Tianmushan and Tunxi, the annual precipitation amounts are very well simulated, with all errors smaller than 5% while at Hangzhou, Huangshan, and Jinhua the precipitation amounts are underestimated and less well simulated, with the largest error at Hangzhou.
Fig.3 Observed and generated annual precipitation amount in the baseline period (1961–1990)
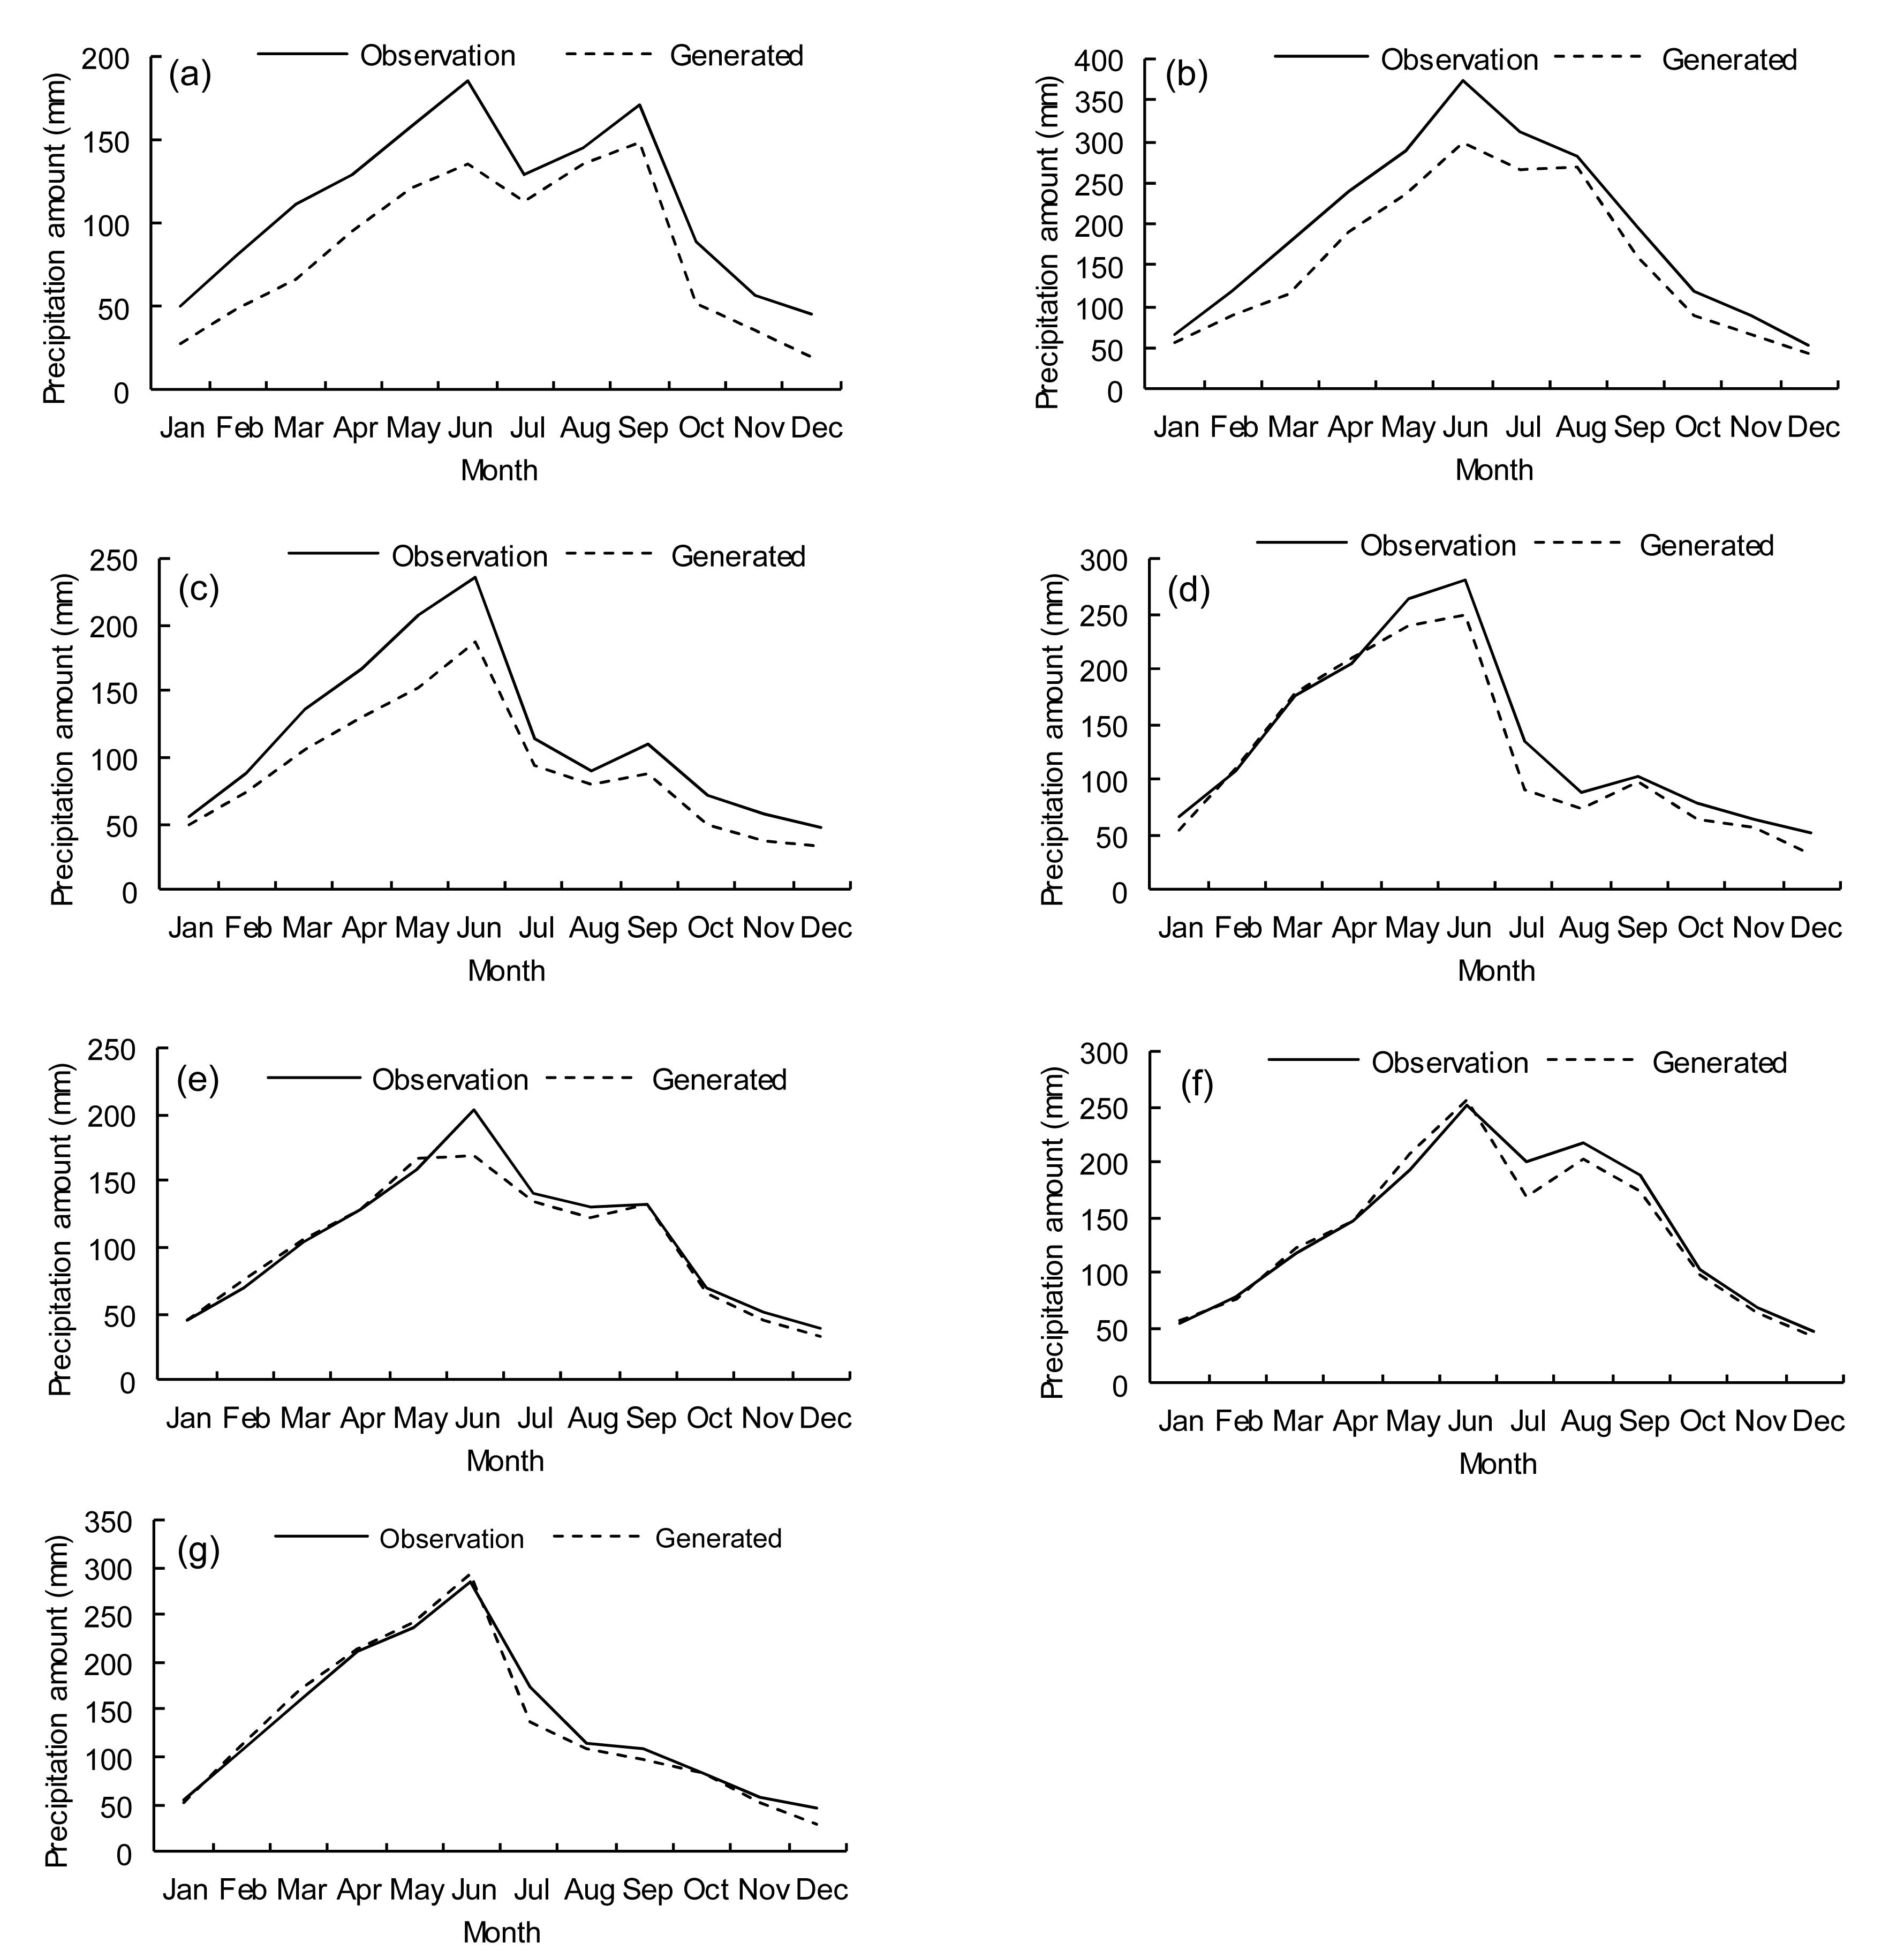
A comparison of observed and generated monthly precipitation amounts in the baseline period (1961–1990) is presented in Fig. 4. Precipitation amounts at Quzhou, Shengxian, Tianmushan, and Tunxi are well simulated. Precipitation amounts are slightly underestimated only in summer. At Hangzhou, Huangshan and Jinhua stations, however, the precipitation amounts are less well simulated. Particularly at Hangzhou, large errors can be found. Such results may imply that the Gamma distribution fails to model the precipitation amounts at these three stations. In general, it can be concluded that the precipitation amounts at these stations are slightly underestimated.
Fig.4 Comparison of observed and generated monthly precipitation amounts in the baseline period (1961–1990) at Hangzhou (a), Huangshan (b), Jinhua (c), Quzhou (d), Shengxian (e), Tianmushan (f), and Tunxi (g)
Fig. 5 shows the comparison between observed and generated monthly precipitation occurrences in the baseline period. It can be observed that the monthly precipitation occurrences are well simulated at stations Huangshan, Jinhua, and Shengxian. At the other stations, the occurrences are also reasonably simulated except at Hangzhou in winter. At all stations, the precipitation occurrences are slightly underestimated.
Fig.5 Comparison of simulated and observed monthly precipitation occurrences at Hangzhou (a), Huangshan (b), Jinhua (c), Quzhou (d), Shengxian (e), Tianmushan (f), and Tunxi (g)
Compared with precipitation occurrences, the simulation of precipitation amounts is better using the GiST model.
3.2. Future precipitation in 2071–2100
Future precipitation from one GCM Hadgem2-ES and one emission scenario RCP 8.5 is downscaled using the GiST stochastic model combined with the CFM. Fig. 6 shows Pearson’s correlations of the baseline generated and future generated daily and monthly precipitation among all pairs of locations. It can be found that the Pearson’s correlations are well preserved on a daily scale. However, the correlations on a monthly scale are somewhat underestimated in the future period. The changes of monthly spatial correlations are mainly caused by the CFM which is implemented on a monthly scale.
Fig.6 Pearson’s correlations of daily precipitation (a) and monthly precipitation (b) in the future period
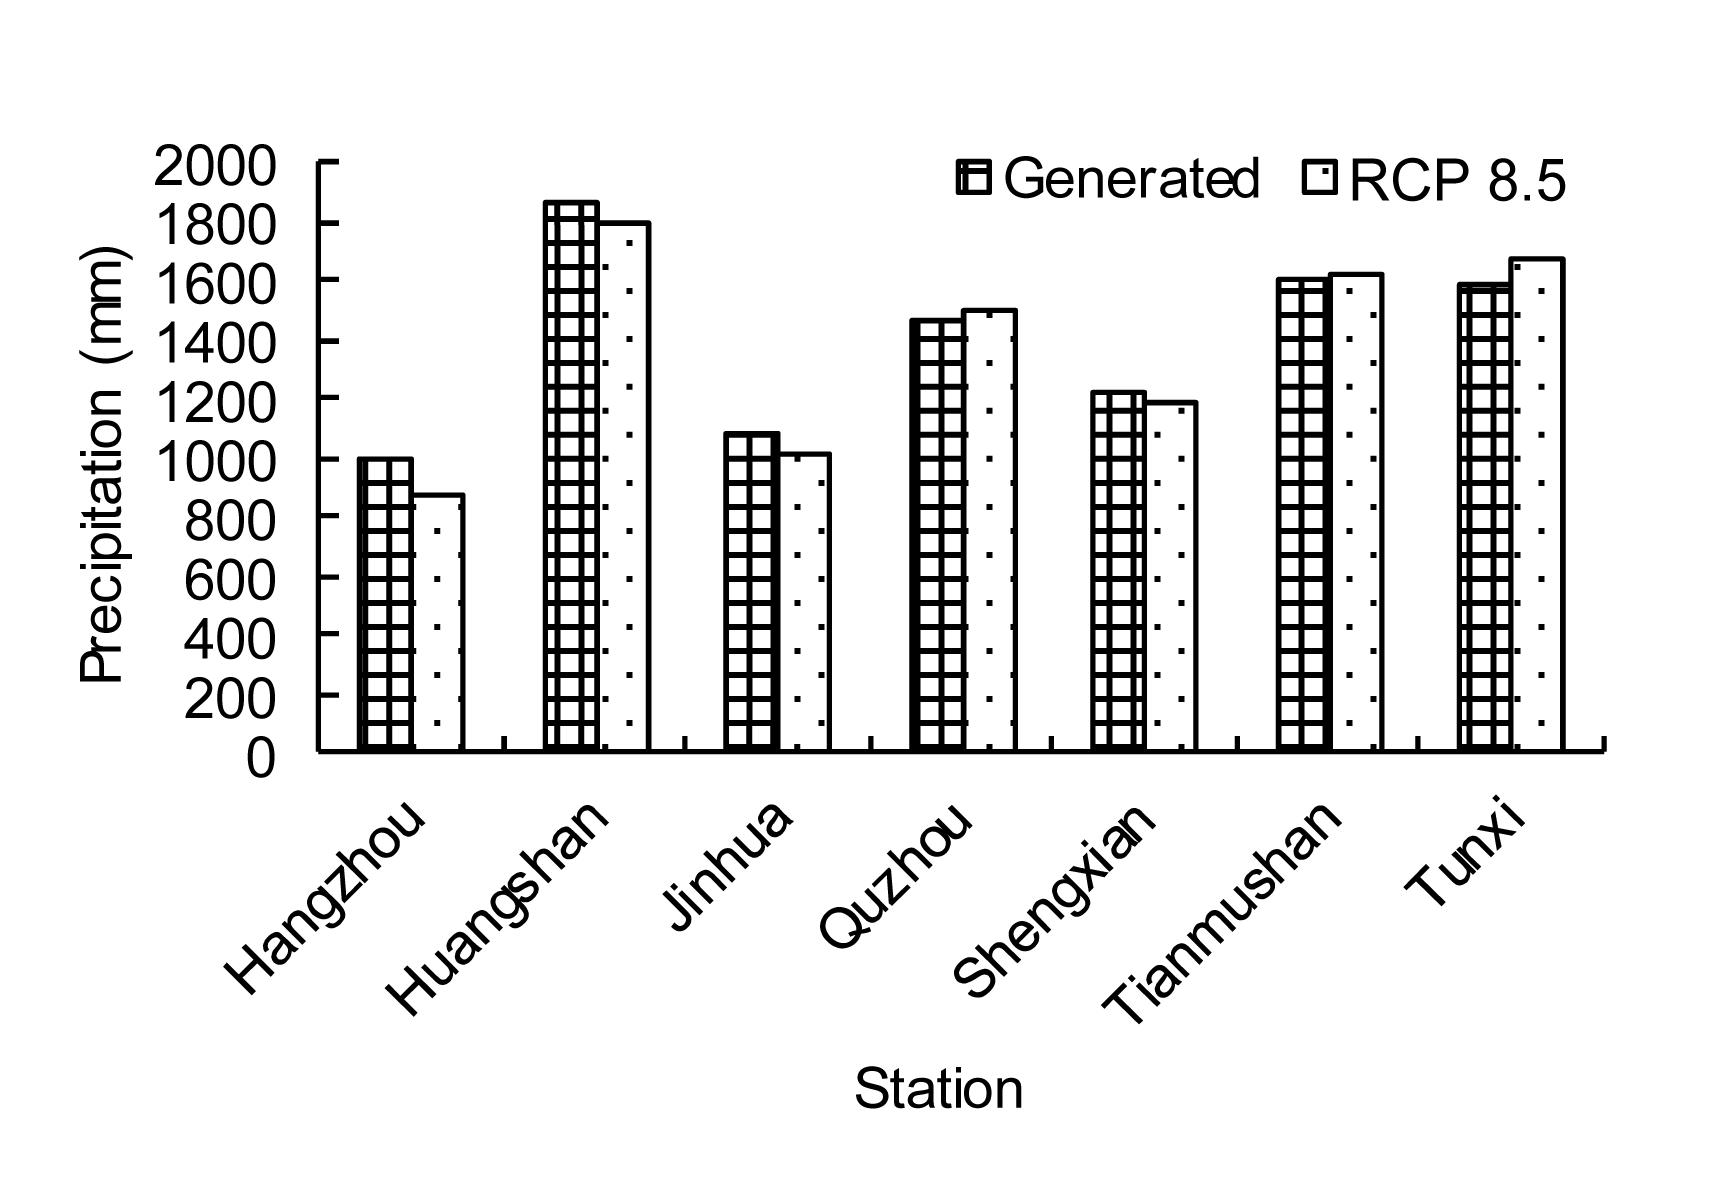
Fig. 7 shows the annual precipitation amounts in the baseline period (generated) and the future period. It is found that there are slight increases at Quzhou, Tianmushan, and Tunxi and decreases at Hangzhou, Huangshan, Jinhua, and Shengxian. However, such changes are not significant. The largest decrease occurs at Hangzhou, reaching 11%.
Fig.7 Future and baseline generated annual precipitation amounts
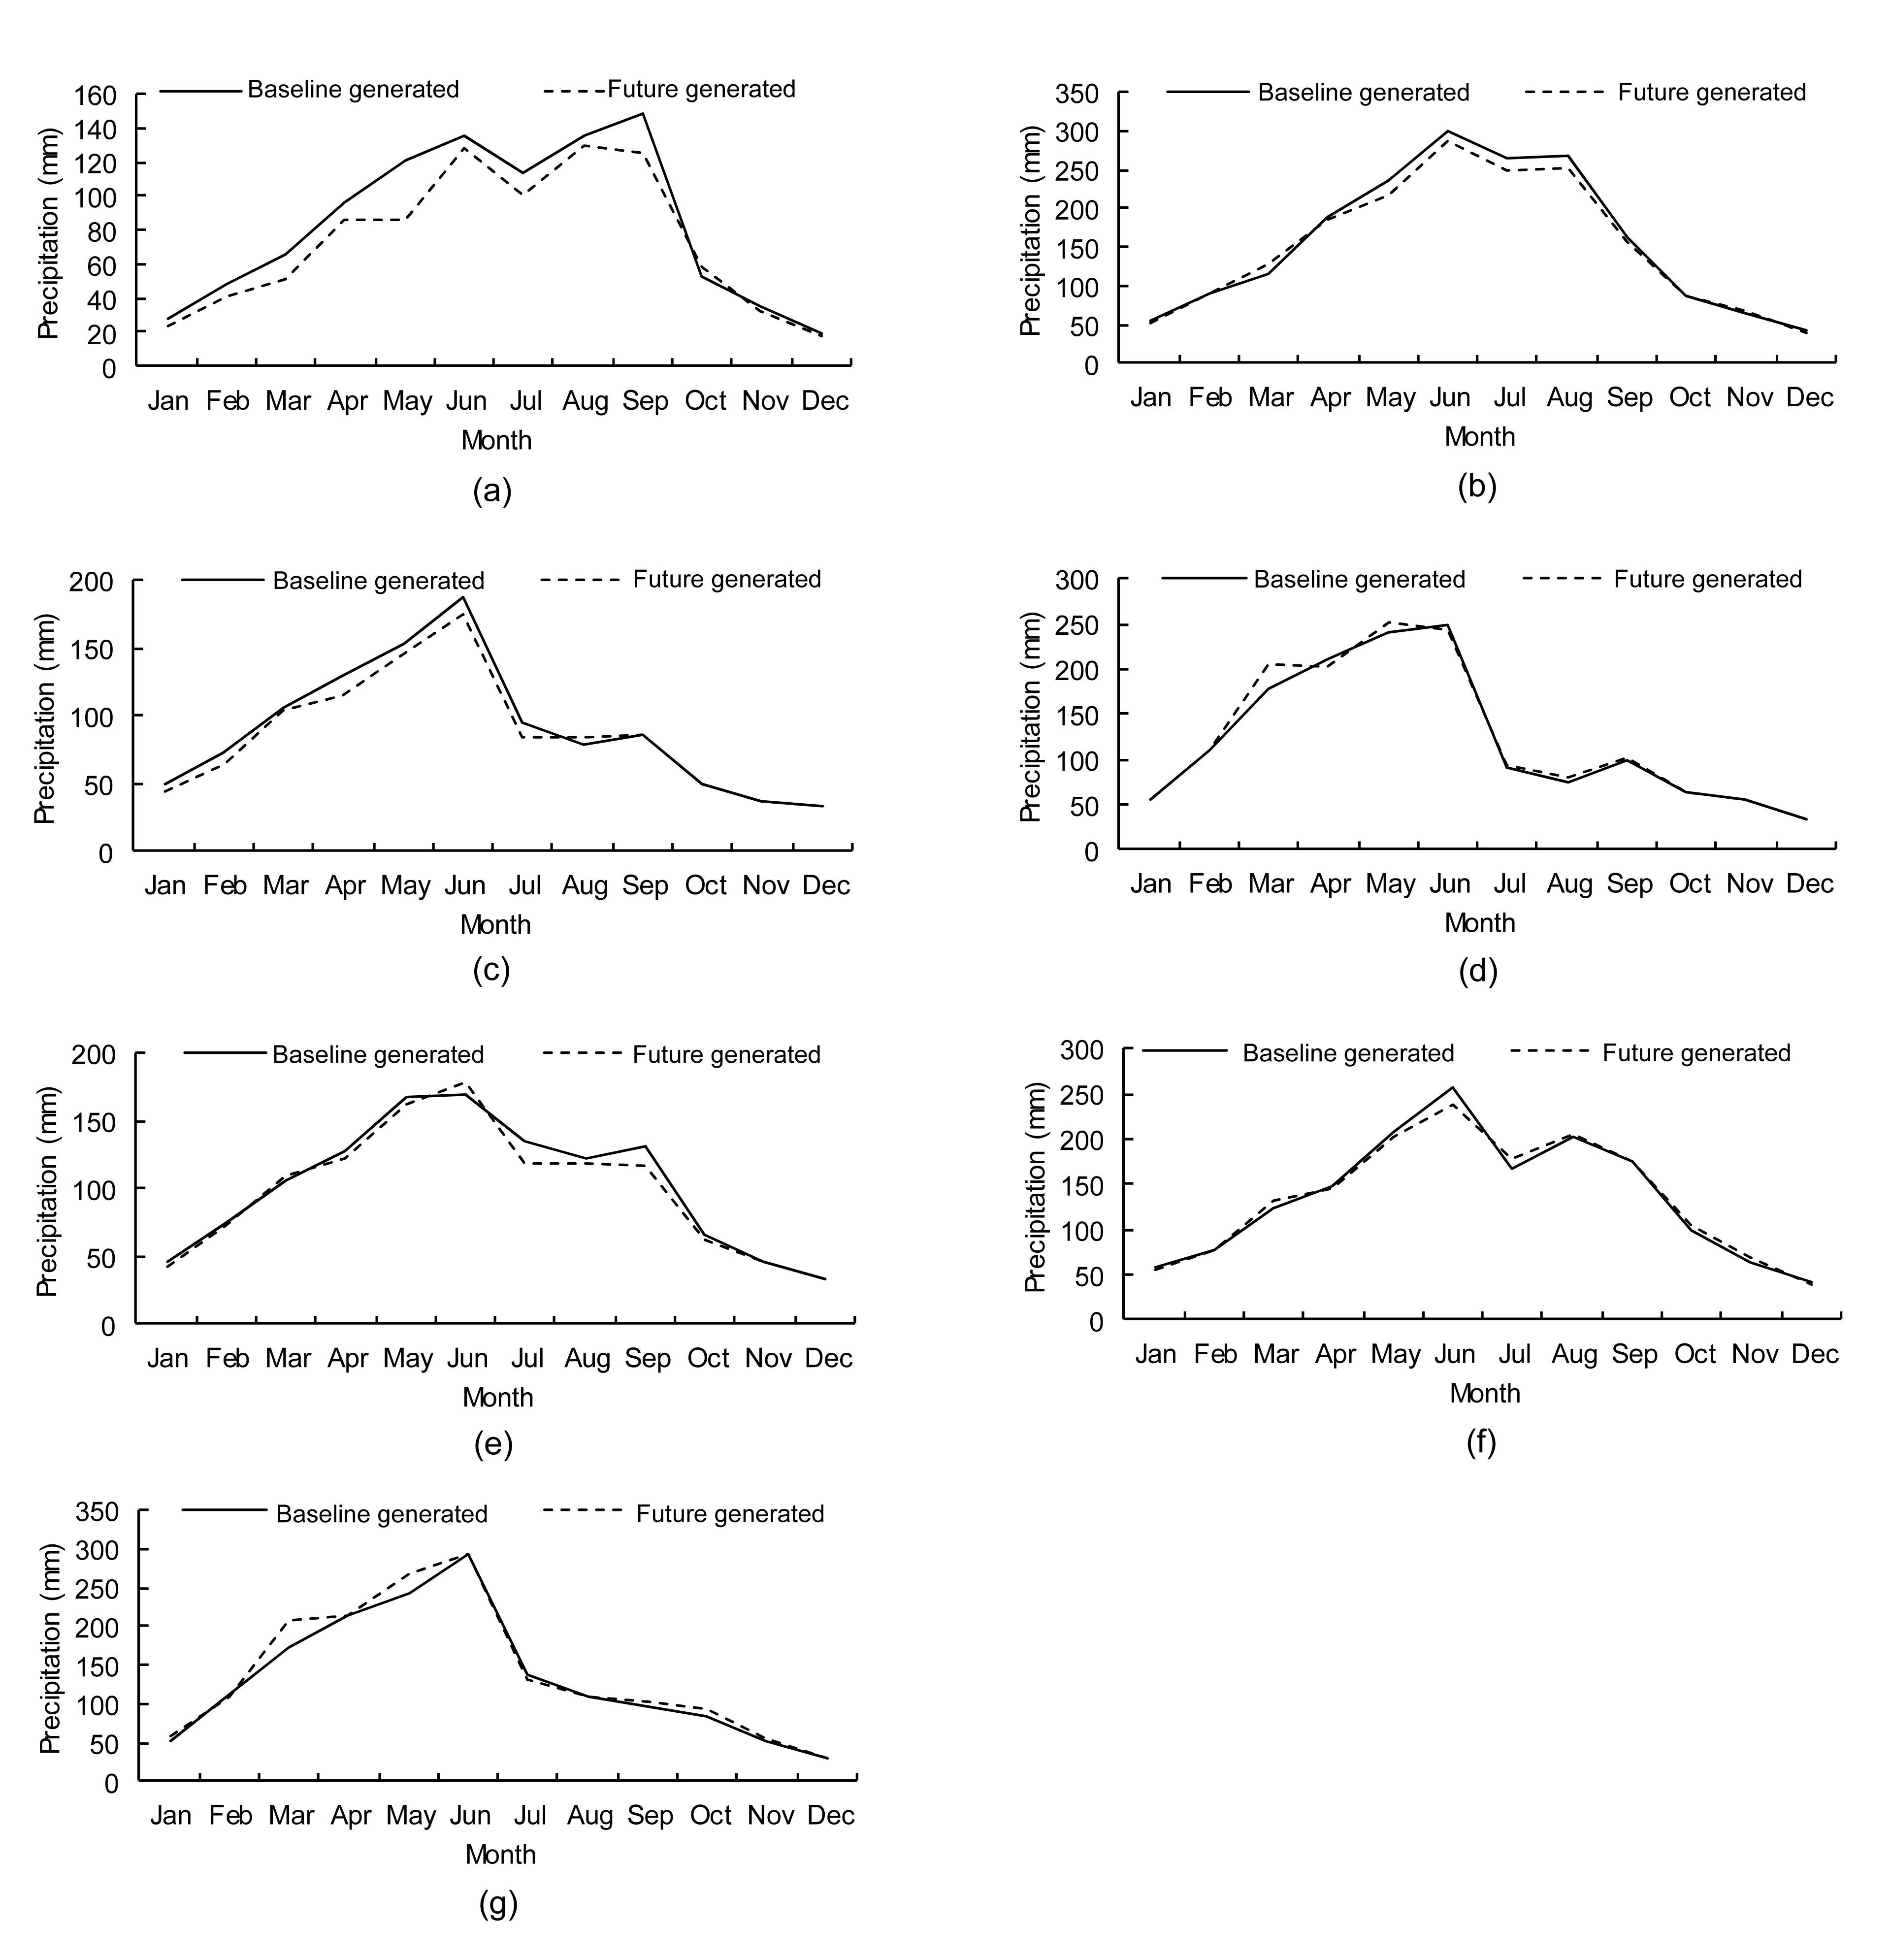
Fig. 8 shows the comparison of baseline and future generated monthly precipitation amounts. It can be found that, except at Hangzhou, the changes in monthly precipitation amounts are relatively small. At Hangzhou, large changes can be found in May and September. Slight decreases of precipitation can be found at Huangshan, Jinhua and Shengxian. Increases can be found at Quzhou, Tianmushan and Tunxi.
Fig.8 Comparison of baseline and future generated monthly precipitation amounts at Hangzhou (a), Huangshan (b), Jinhua (c), Quzhou (d), Shengxian (e), Tianmushan (f), and Tunxi (g)
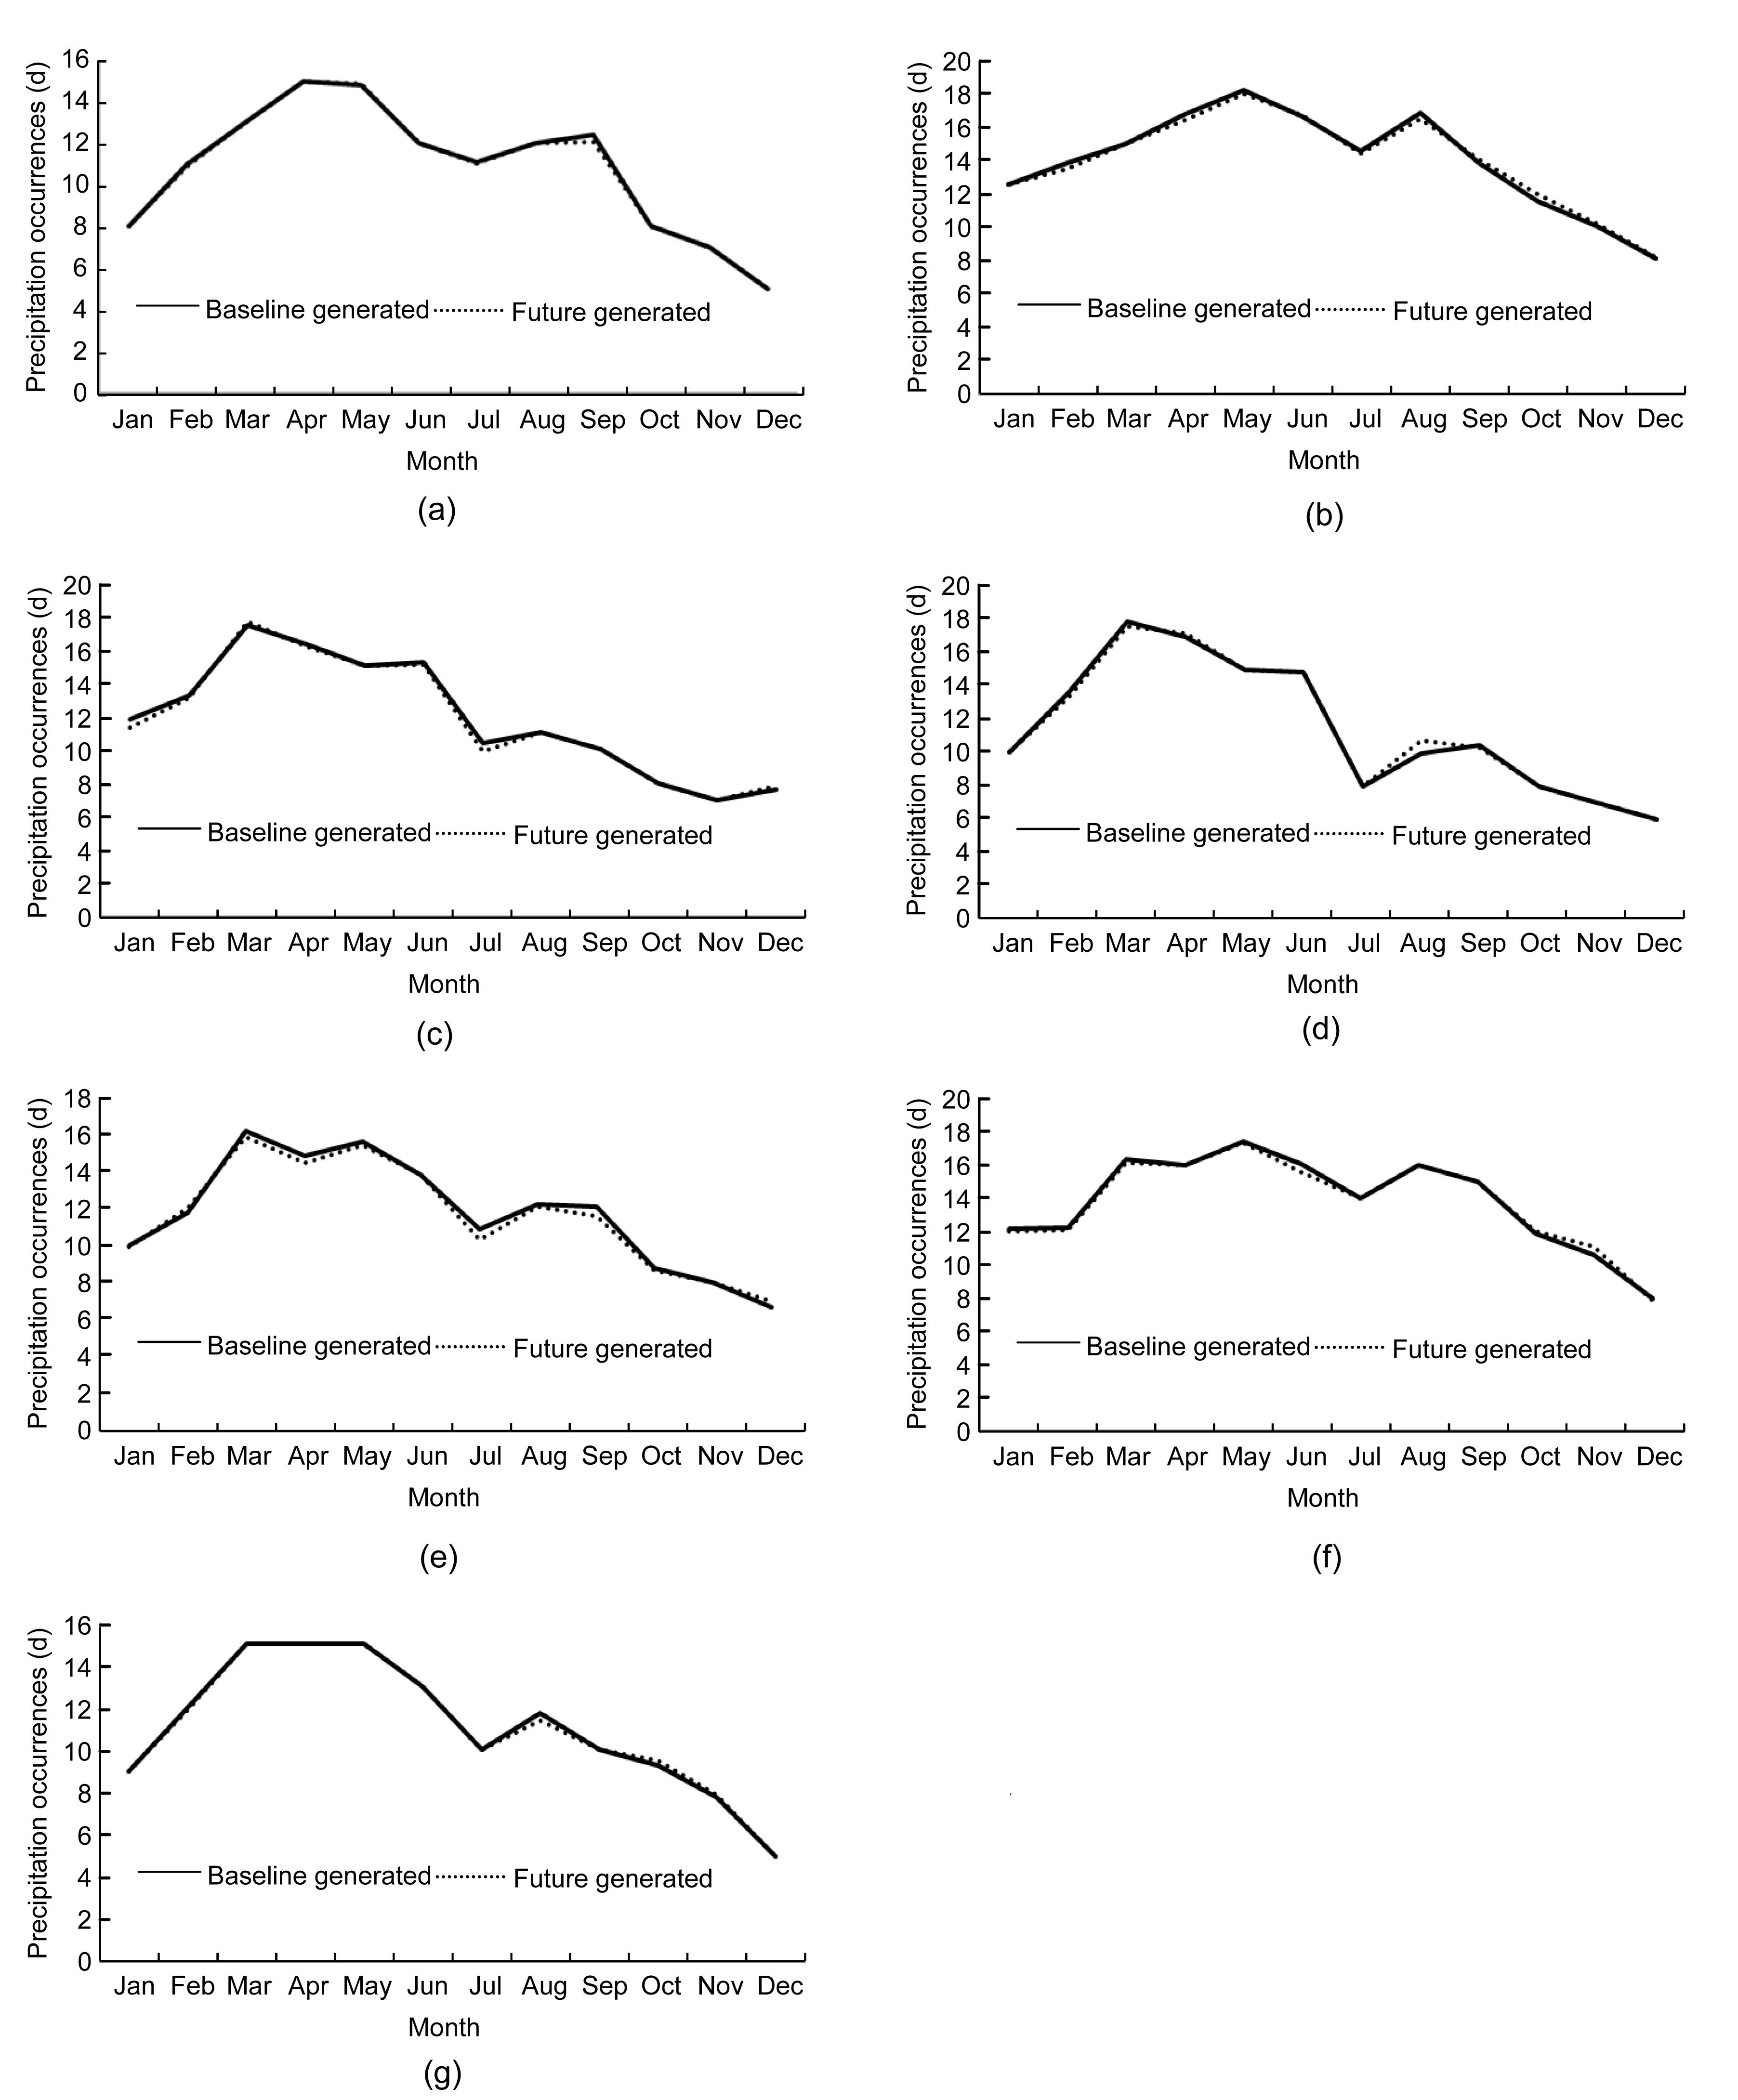
Fig. 9 (p.227) shows the comparison of baseline and future generated precipitation occurrences at seven stations. It is found that, compared to the baseline period, the precipitation occurrences at all stations remain more or less stable. This indicates that the downscaling approach (GiST combined with the change factor model) preserves the precipitation occurrences very well. This is understandable since the CFM was used on a monthly scale and only affected the precipitation amounts at seven stations.
Fig.9 Comparison of baseline and future generated precipitation occurrences at Hangzhou (a), Huangshan (b), Jinhua (c), Quzhou (d), Shengxian (e), Tianmushan (f), and Tunxi (g)
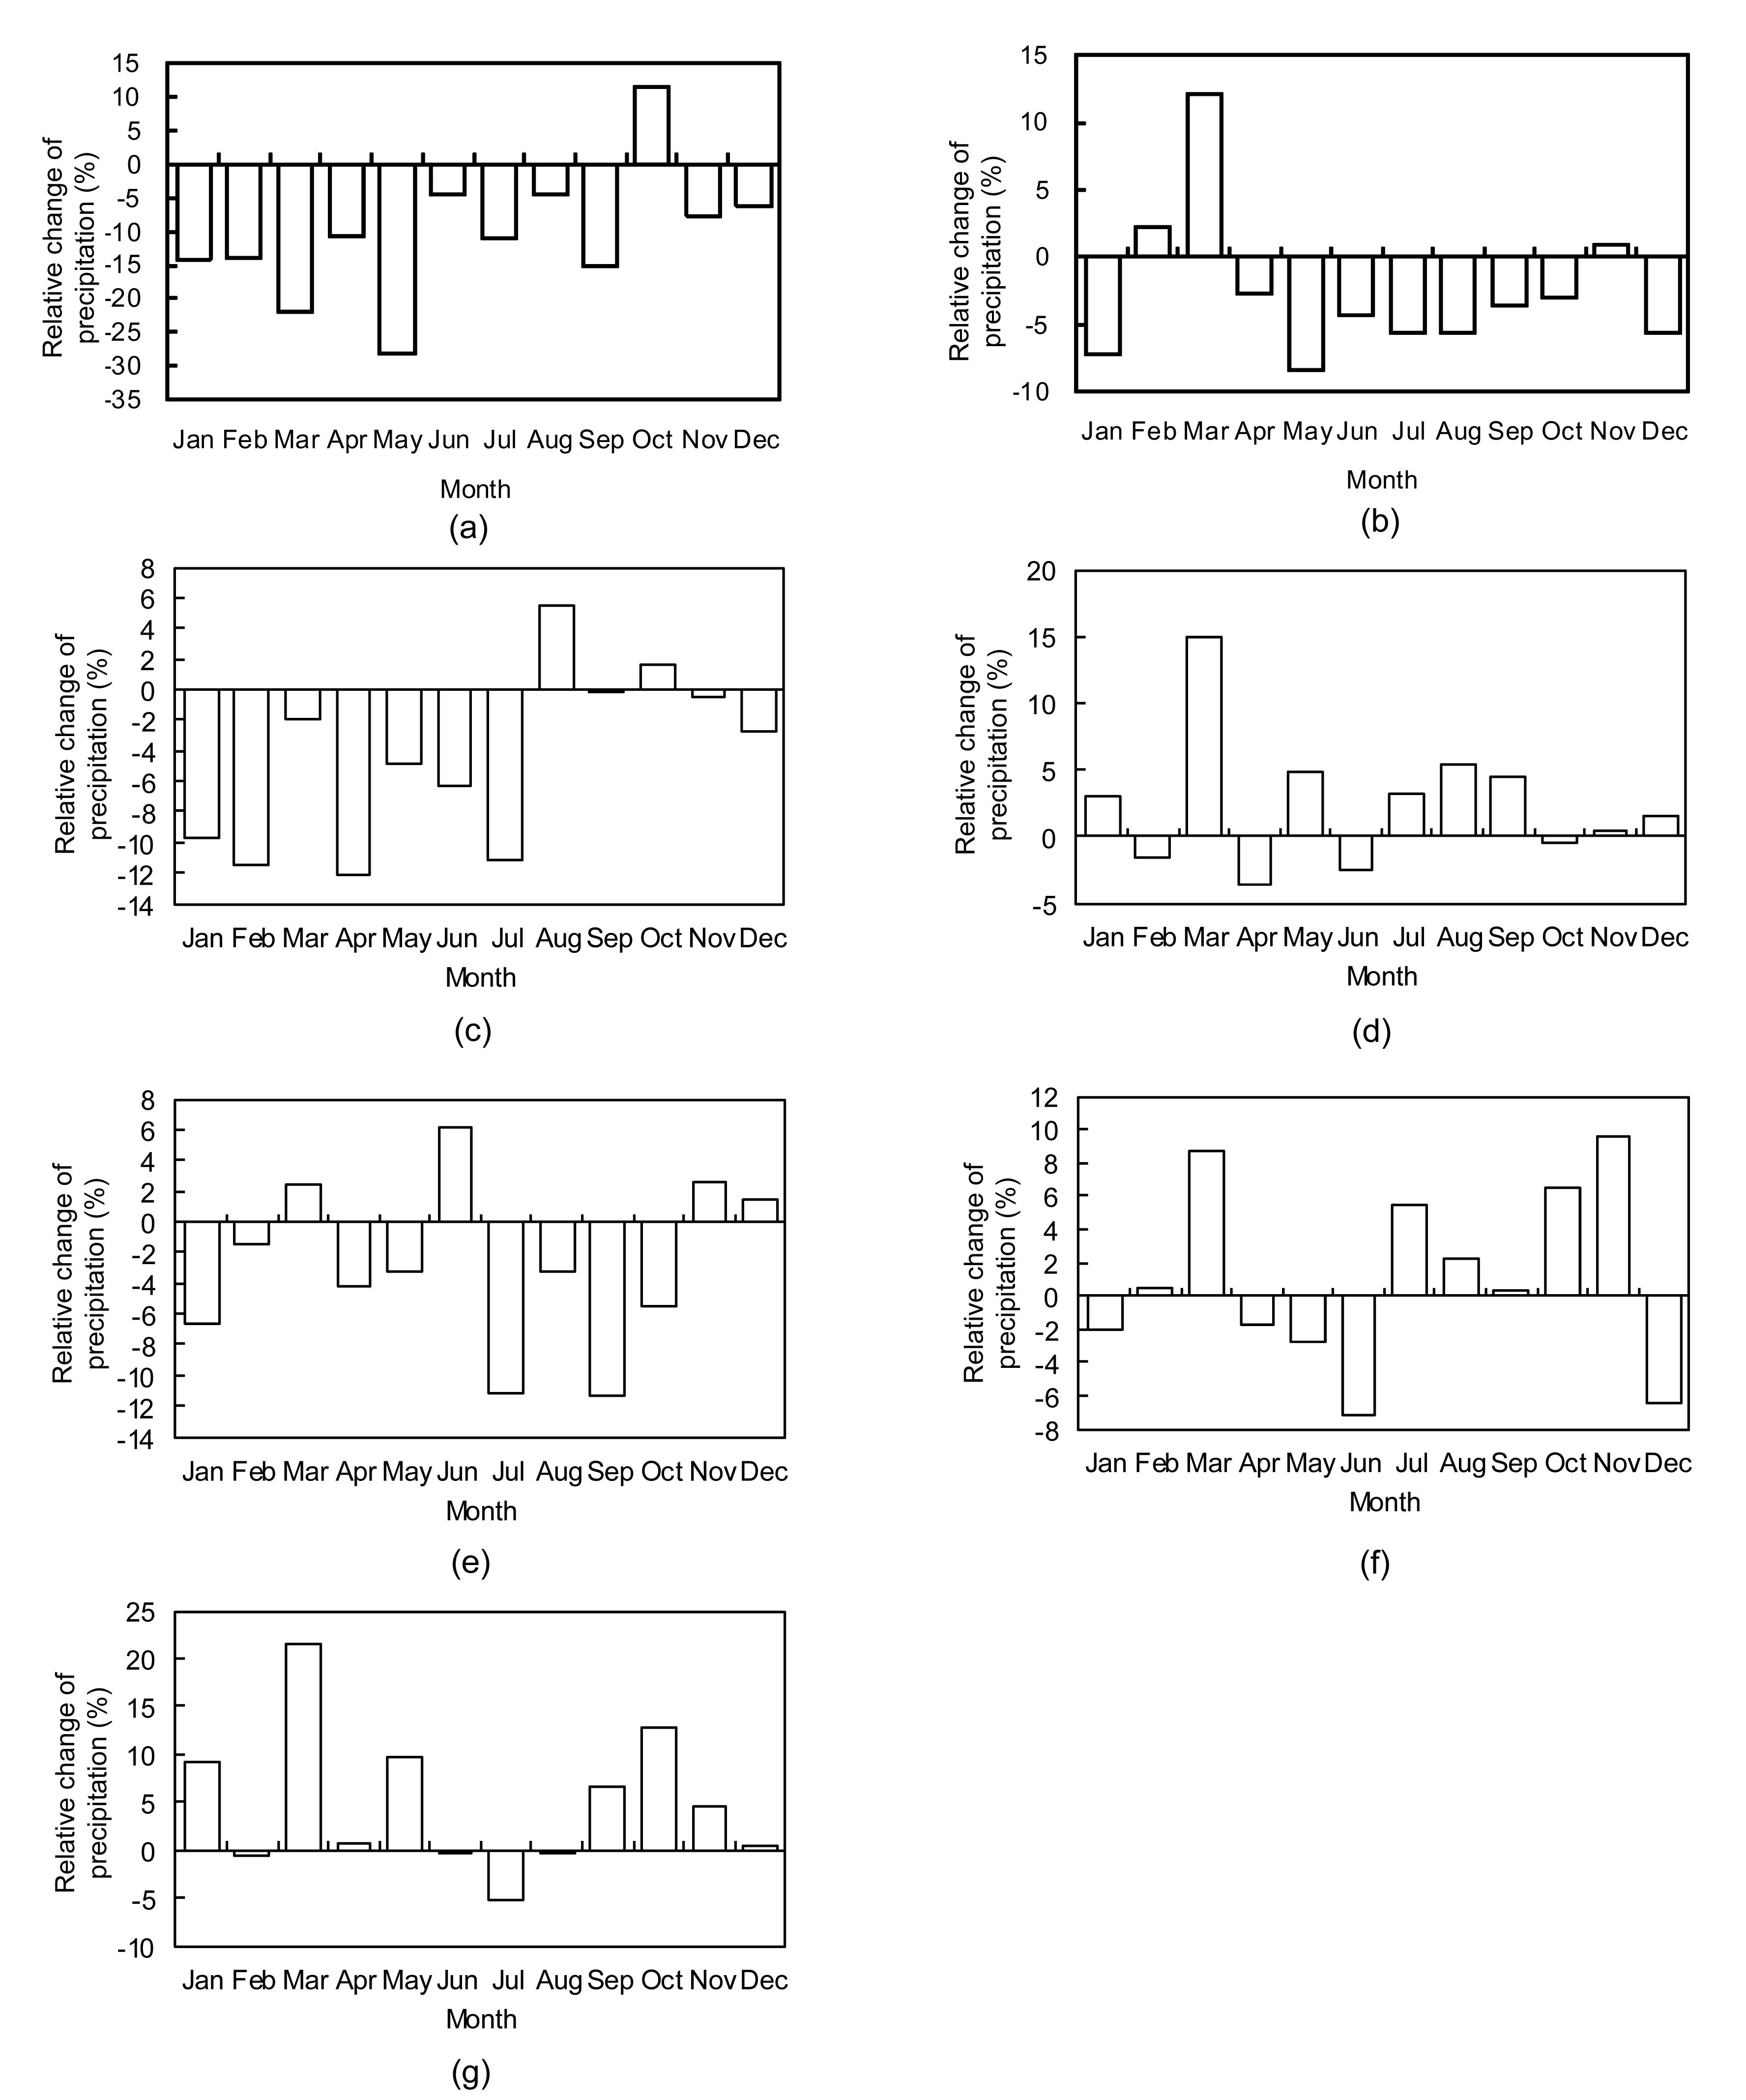
To check more closely the future changes of precipitation in 2071–2100, Fig. 10 (p.228) shows the relative changes of monthly precipitation for Hadgem2_ES under RCP 8.5 at seven stations. Fig. 10 shows more clearly than Fig. 8 that the monthly precipitations decrease in most months at Hangzhou, Huangshan, Jinhua, and Shengxian. The largest decrease can be found at Hangzhou in May and approaches 30%. The decreases at the other three stations are much smaller than at Hangzhou. Most decreases are up to 12%. At Quzhou, Tianmushan and Tunxi, increases can be found in many months, particularly in March, the increases are up to 20% at Tunxi. From this figure, it implies that stations in relatively high elevations like Tunxi and Tianmushan often experience increases in precipitation while stations in plains often experience decreases in precipitation. Among these stations, Hangzhou (city) has the largest population and the most economic development. A large fall in precipitation in the future may add more stress to the water shortage problem that already exists.
Fig.10 Relative changes of monthly precipitation in 2071–2100 for Hadgem2_ES under RCP 8.5 at Hangzhou (a), Huangshan (b), Jinhua (c), Quzhou (d), Shengxian (e), Tianmushan (f), and Tunxi (g)
4. Conclusions and discussion
The main purpose of this paper is to evaluate the performance of a new multi-site weather generator GiST in the Qiantang River Basin, East China. Future changes in precipitation under RCP 8.5 and Hadgem2_ES for the future period 2071–2100 are also projected to illustrate the usefulness of the multi-site weather generator. The spatial structure of weather information for the given region was considered in this study. The final results indicate that the multi-site weather generator can model the spatial correlations of precipitation appropriately although slight underestimation for the daily correlations and slight overestimation for the monthly correlations can still be found. The results of this study can be used for hydrological modeling or providing implications for water resources management and extreme event risk assessment. This study also illustrates the potential of GiST applied to investigation of the impact of climate change on hydrology and water resources.
At some stations like Hangzhou, the GiST multi-site weather generator is found to underestimate the monthly precipitation amount. This is probably because the Gamma distribution adopted in the multi-site weather generator may fail to model the precipitation amount at Hanghzou. It is therefore proposed that a more reasonable probability distribution be adopted to further improve the accuracy of generated precipitation by GiST model. Moreover, the number of stations used in the orthogonal Markov chains may affect the final results although this is probably constrained by the number of parallel observations at all stations.
Only one GCM and one emission scenario were used in this study to obtain future precipitation projections in 2071–2100 for illustration of the usefulness of the multi-site weather generator. It must be kept in mind that the results based on a single GCM and emission scenario are full of uncertainty. The uncertainty in impact analysis of climate change often originates from GCM structures, emission scenarios, downscaling approaches, and impact analysis models (Wilby and Harris, 2006; Teng et al., 2012; Xu et al., 2013). A formal uncertainty analysis is therefore necessary before climate change impact analysis results are finally used in water management.
Acknowledgements
We also thank Dr. Guillermo A. BAIGORRIA of the University of Florida, USA for providing the GiST model and the National Climate Center of China Meteorological Administration for providing meteorological data for the Qiantang River Basin.
[1] Anandhi, A., Frei, A., Pierson, D.C., 2011. Examination of change factor methodologies for climate change impact assessment. Water Resources Research, 47(3):W03501
[2] Baigorria, G.A., Jones, J.W., 2010. GiST: A stochastic model for generating spatially and temporally correlated daily rainfall data. Journal of Climate, 23(22):5990-6008.
[3] Brissette, F.P., Khalili, M., Leconte, R., 2007. Efficient stochastic generation of multi-site synthetic precipitation data. Journal of Hydrology, 345(3-4):121-133.
[4] Clark, M., Gangopadhyay, S., Hay, L., 2004. The Schaake shuffle: a method for reconstructing space-time variability in forecasted precipitation and temperature fields. Journal of Hydrometeorology, 5(1):243-262.
[5] Fowler, H.J., Blenkinsop, S., Tebaldi, C., 2007. Linking climate change modelling to impacts studies: recent advances in downscaling techniques for hydrological modelling. International Journal of Climatology, 27(12):1547-1578.
[6] Jones, C.D., Hughes, J.K., Bellouin, N., 2011. The HadGEM2-ES implementation of CMIP5 centennial simulations. Geoscientific Model Development, 4(3):543-570.
[7] Ju, H., Lin, E.D., Wheeler, T., 2013. Climate change modelling and its roles to Chinese crops yield. Journal of Integrative Agriculture, 12(5):892-902.
[8] Khalili, M., Leconte, R., Brissette, F., 2007. Stochastic multisite generation of daily precipitation data using spatial autocorrelation. Journal of hydrometeorology, 8(3):396-412.
[9] Khan, M.S., Coulibaly, P., Dibike, Y., 2006. Uncertainty analysis of statistical downscaling methods. Journal of Hydrology, 319(1-4):357-382.
[10] Kilsby, C.G., Jones, P.D., Burton, A., 2007. A daily weather generator for use in climate change studies. Environmental Modeling & Software, 22(12):1705-1719.
[11] Mehrotra, R., Srikanthan, R., Sharma, A., 2006. A comparison of three stochastic multi-site precipitation occurrence generators. Journal of Hydrology, 331(1-2):280-292.
[12] Nicks, A.D., Gander, G.A., 1994. CLIGEN: A weather generator for climate inputs to water resource and other models. , Proceedings of Fifth International Conference on Computers in Agriculture, 903-909. :903-909.
[13] Qian, B., Hayhoe, H., Gameda, S., 2005. Evaluation of the stochastic weather generators LARS-WG and AAFC-WG for climate change impact studies. Climate Research, 29:3-21.
[14] Racsko, P., Szeidl, L., Semenov, M., 1991. A serial approach to local stochastic weather models. Ecological Modelling, 57(1-2):27-41.
[15] Salvi, K., Kannan, S., Ghosh, S., 2013. High-resolution multisite daily rainfall projections in India with statistical downscaling for climate change impacts assessment. Journal of Geophysical Research: Atmospheres, 118(9):3557-3578.
[16] Schoof, J.T., Pryor, S.C., 2001. Downscaling temperature and precipitation: a comparison of regression-based methods and artificial neural networks. International Journal of Climatology, 21(7):773-790.
[17] Semenov, M.A., Barrow, E.M., 1997. Use of a stochastic weather generator in the development of climate change scenarios. Climatic Change, 35(4):397-414.
[18] Teng, J., Jai, V., Chiew, F.H.S., 2012. Estimating the relative uncertainties sourced from GCMs and hydrological models in modeling climate change impact on runoff. Journal of Hydrometeorology, 13(1):122-139.
[19] Thyer, M., Kuczera, G., 2003. A hidden Markov model for modelling long-term persistence in multi-site rainfall time series. 2. Real data analysis. Journal of Hydrology, 275(1):27-48.
[20] Wang, G.Q., Zhang, J.Y., Jin, J.L., 2012. Assessing water resources in China using PRECIS projections and a VIC model. Hydrology and Earth System Sciences, 16(1):231-240.
[21] Wilby, R.L., Wigley, T.M.L., 1997. Downscaling general circulation model output: a review of methods and limitations. Progress in Physical Geography, 21(1-4):530-548.
[22] Wilby, R.L., Harris, I., 2006. A framework for assessing uncertainties in climate change impacts: low-flow scenarios for the River Thames, UK. Water Resources Research, 42(2):W02419
[23] Wilby, R.L., Dawson, C.W., 2013. The statistical downscaling model: insights from one decade of application. International Journal of Climatology, 33(7):1707-1719.
[24] Wilks, D.S., 1998. Multisite generalization of a daily stochastic precipitation generation model. Journal of Hydrology, 210(1):178-191.
[25] Xu, Y.P., Zhang, X.J., Tian, Y., 2012. Impact of climate change on 24-h design rainfall depth estimation in Qiantang River Basin, East China. Hydrological Processes, 26(26):4067-4077.
[26] Xu, Y.P., Zhang, X.J., Ran, Q.H., 2013. Impact of climate change on hydrology of upper reaches of Qiangtang River Basin, East China. Journal of Hydrology, 483:51-60.
[27] Zhai, P., Zhang, X., Wan, H., 2005. Trends in total precipitation and frequency of daily precipitation extremes over China. Journal of Climate, 18(7):1096-1108.
Open peer comments: Debate/Discuss/Question/Opinion


Open peer comments: Debate/Discuss/Question/Opinion
<1>